Phalcon Debug makes transaction analysis much easier when a transaction is too complex to understand from the surface view alone. Instead of stopping at a high-level transaction trace, it lets users step into the execution flow, inspect verified code, and follow internal logic in detail. That makes it especially useful for exploit analysis, root-cause investigation, and team collaboration.
In this guide, we use the Euler protocol exploit transaction as an example. The goal is to show how Phalcon Debug helps users move from a suspicious transaction step to a clear explanation of what happened and why it mattered.
You can open the transaction directly here: Phalcon transaction page
How to Enter Debug Mode
There are two main ways to enter debug mode in Phalcon.
The first is from a specific row in the Invocation Flow view. The second is through the Debug button in the upper right corner of the transaction page. Both lead to the same debugging environment, but starting from the Invocation Flow is often more useful when you already see a suspicious step and want to jump in at that exact point.
In the Euler exploit example, the transaction contains many steps, including borrowing a flash loan from Aave and depositing DAI into Euler. One especially suspicious step is the call to donateToReserves(), where the attacker donates a very large amount to the protocol. That is the kind of action that often deserves deeper review, and Phalcon Debug lets users start analysis right there.
Debug View Layout
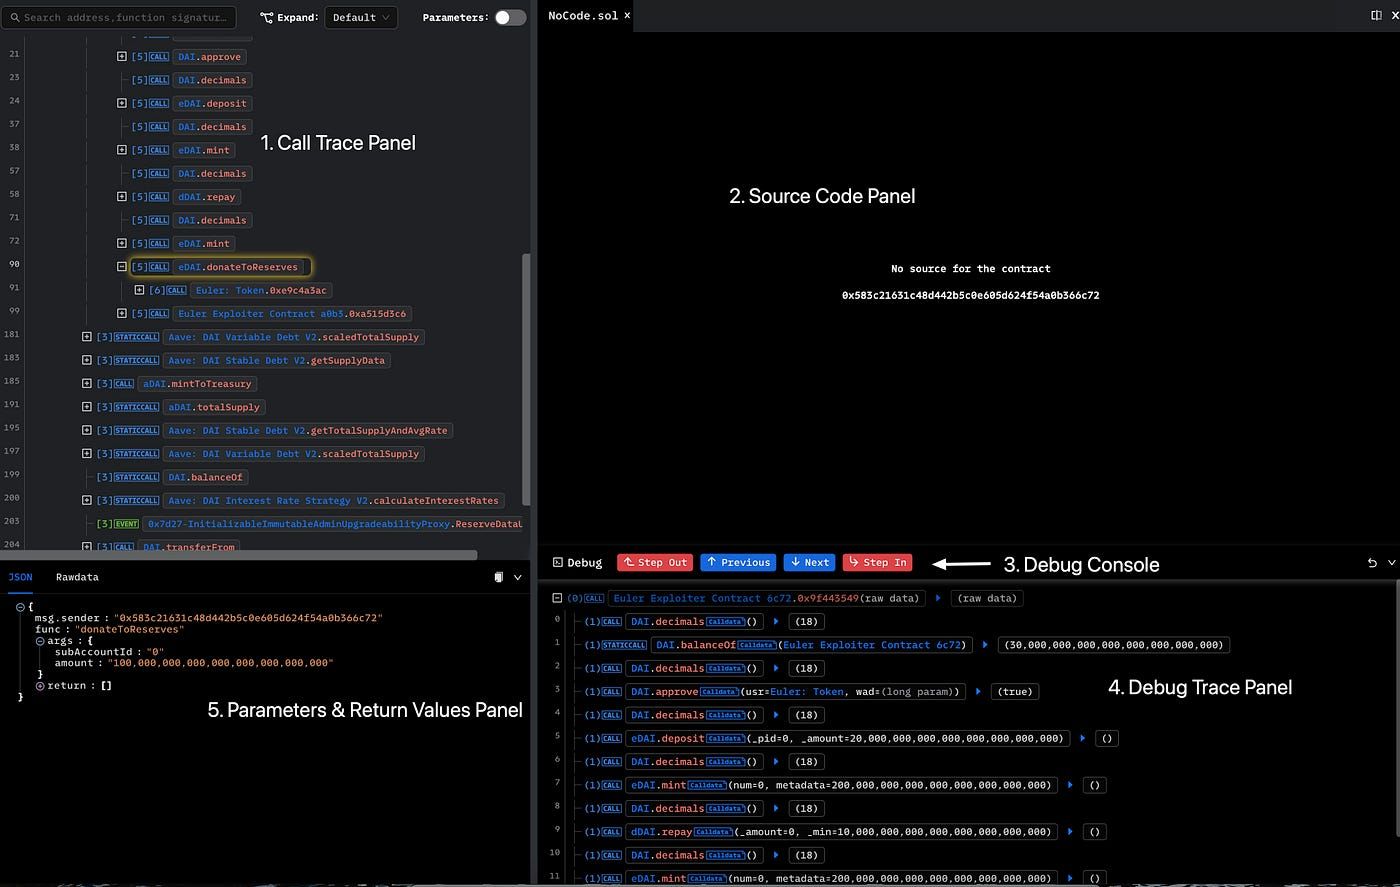
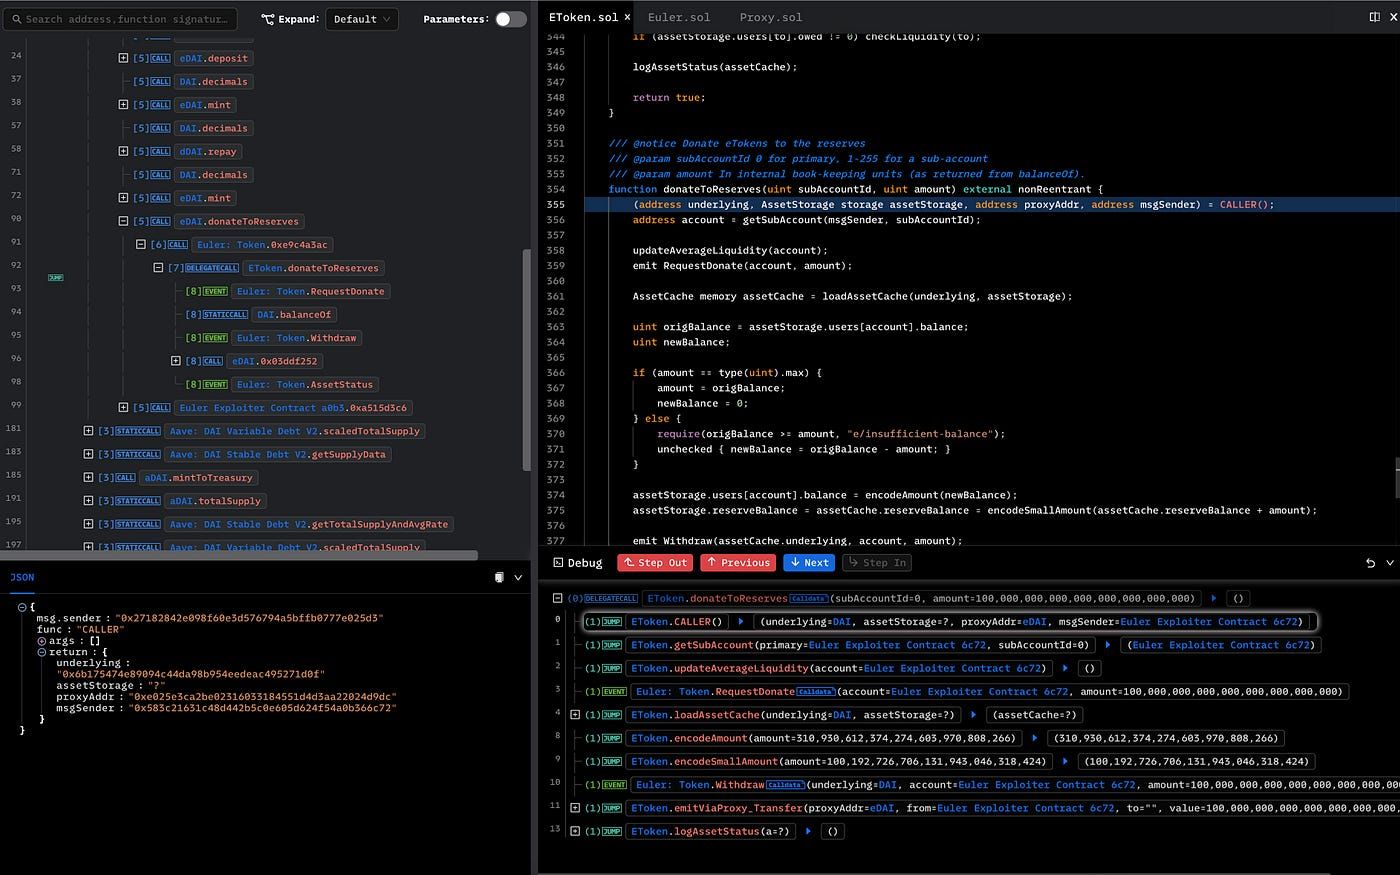
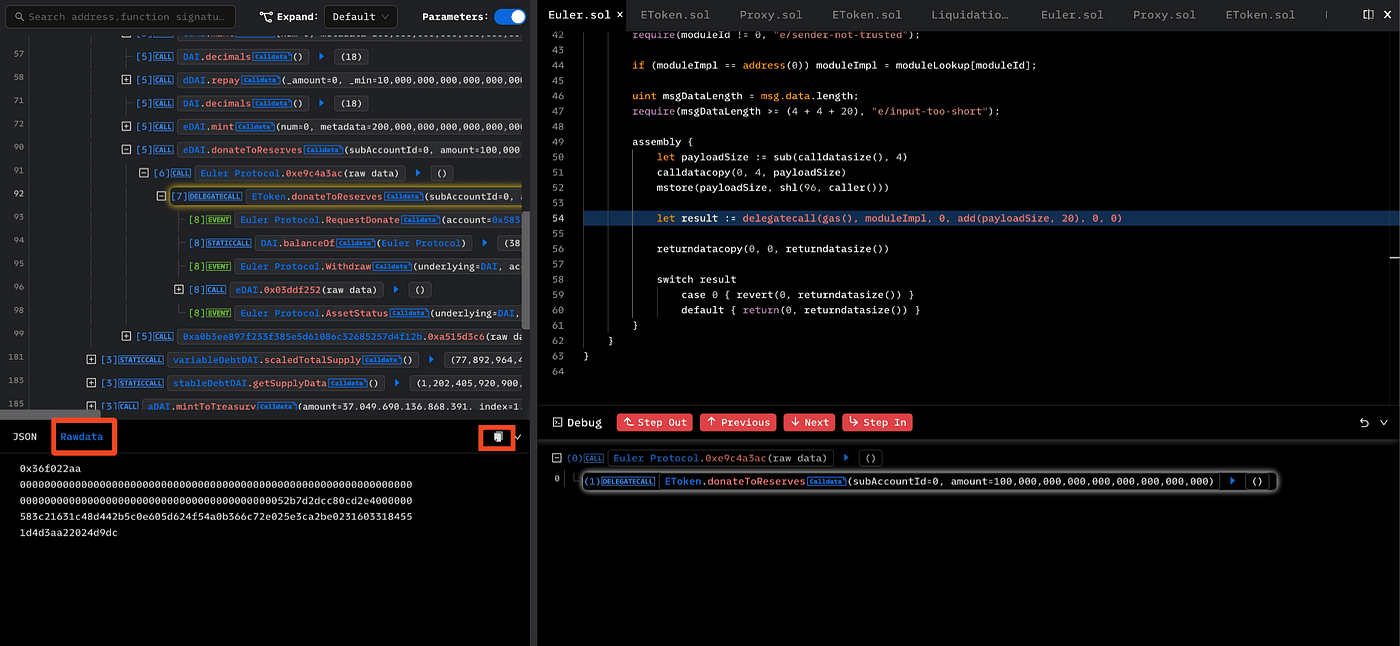
After entering debug mode, Phalcon shows a workspace built for step-by-step transaction analysis. The layout includes five core panels.
The Call Trace Panel shows the trace of external calls and events. The Source Code Panel shows the source code of the current contract and highlights the relevant line. The Debug Console provides call-level step controls. The Debug Trace Panel shows the current contract call stack with both internal and external calls. The Parameters & Return Values Panel shows inputs and outputs for the current call.
This layout is useful because users do not need to jump between several tools just to understand one part of the transaction. They can read the trace, inspect code, and follow execution logic in one place.
Sometimes the source code panel may not show code. That usually happens when the current call points to an unverified contract. In this Euler case, the attacker contract is not verified, so the source code is not available there. But the eDai contract is verified, which means users can Step In and continue the analysis inside verified logic.
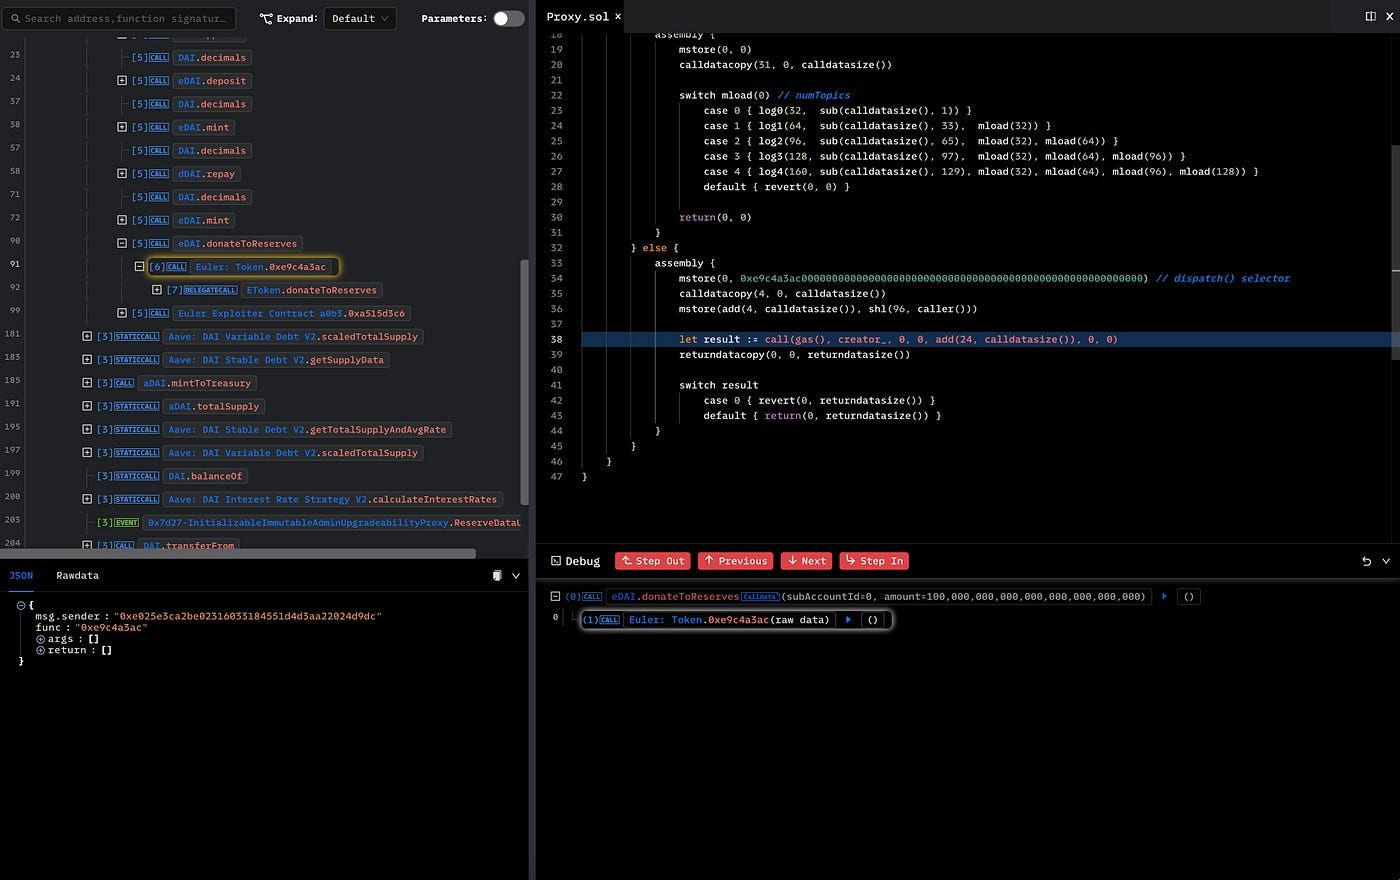
After stepping into the verified eDai contract, users can move deeper into the implementation of donateToReserves() and inspect the exact code path behind the suspicious transaction step.
How to Use the Debug Console
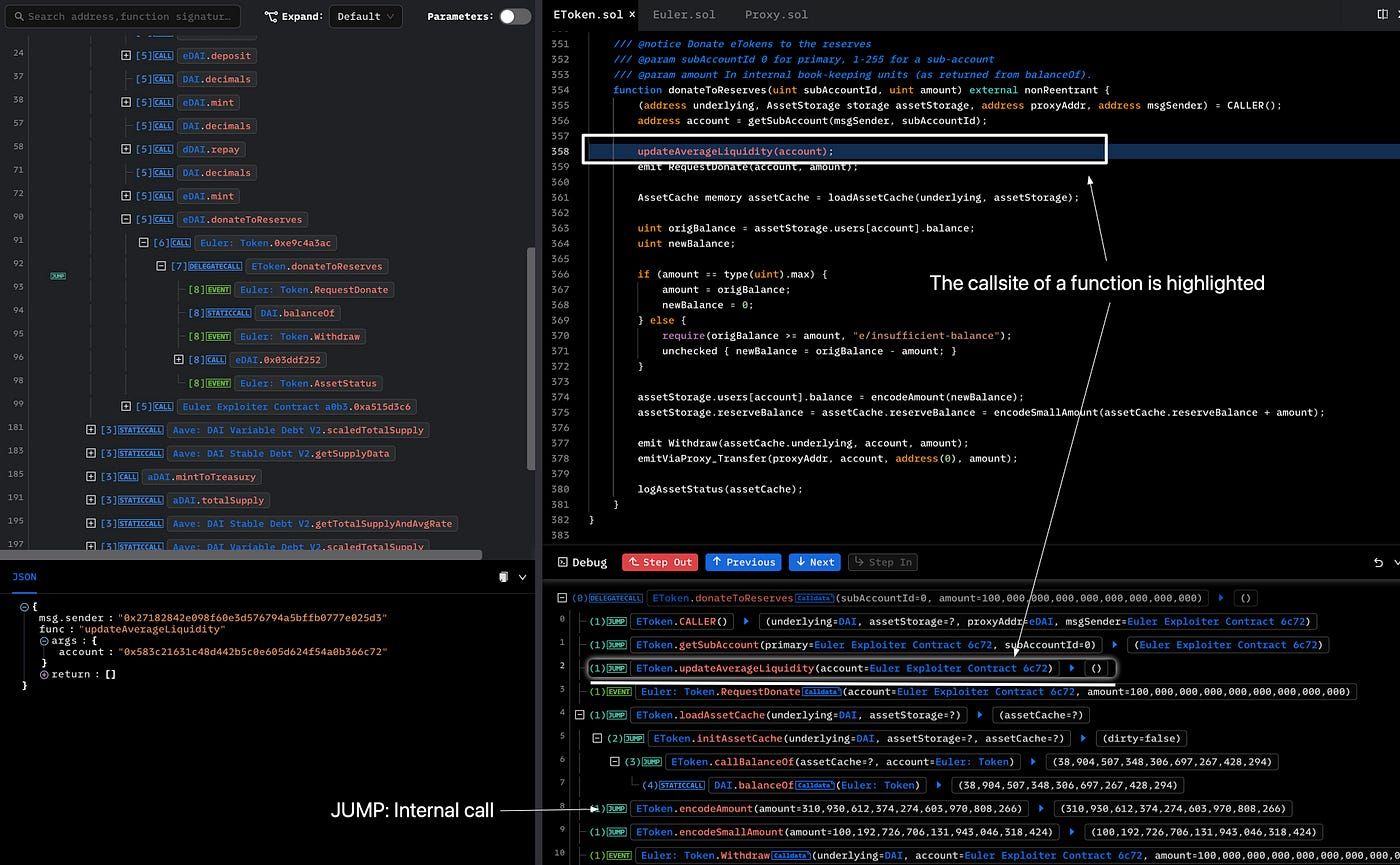
The debug console is designed to help users move through transaction execution in detail. This is important because the Call Trace Panel only shows external calls and events. It does not show internal function calls. The debug console fills that gap.
Phalcon provides several navigation controls in this panel. Next and Previous each have two versions. The red buttons move through the full call trace, while the blue buttons move within the current function. Step In moves into the callee function. Step Out returns to the call site of the current function.
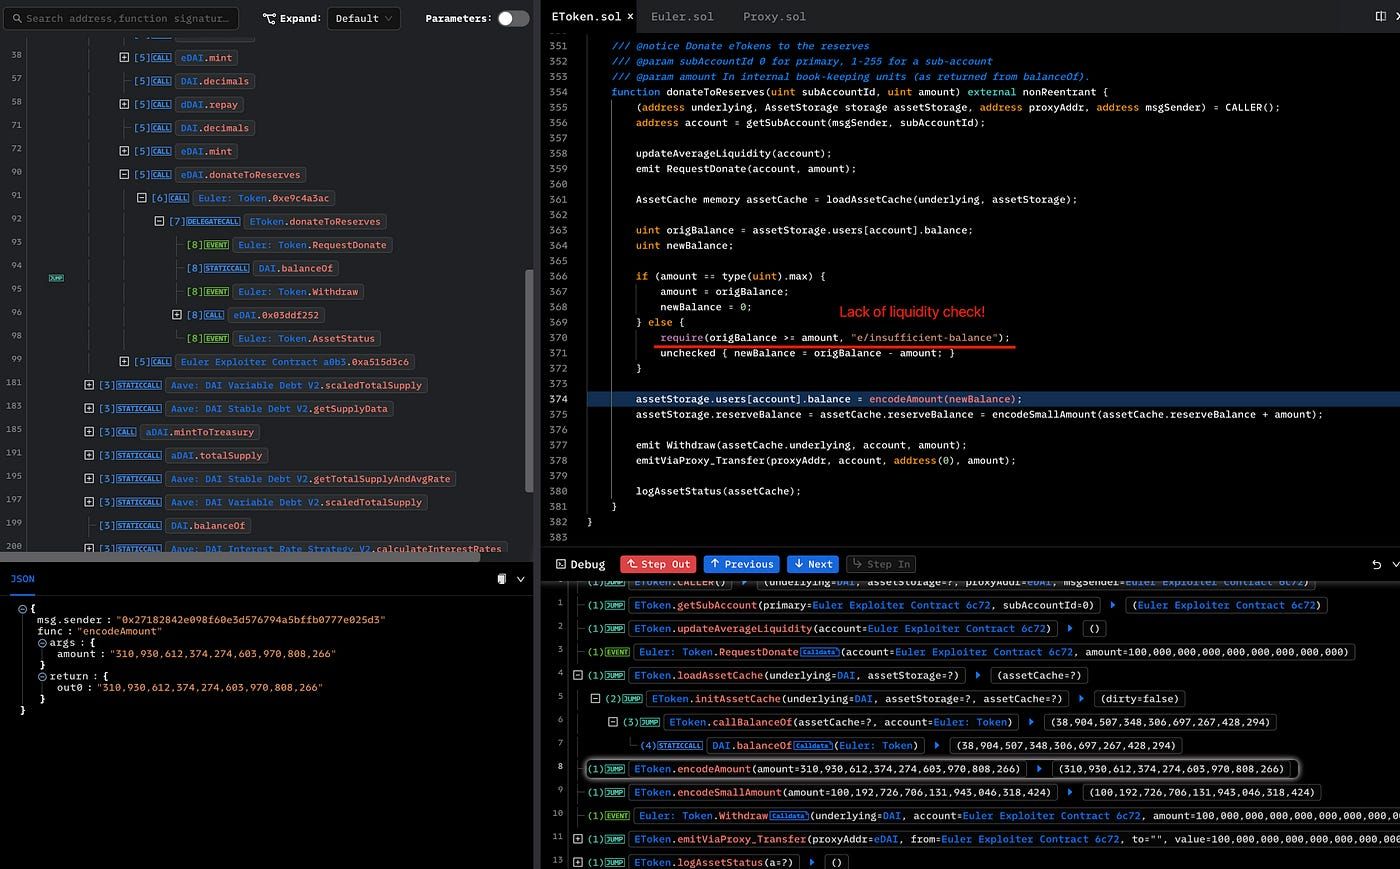
With these controls, users can move through contract logic line by line and understand how state changes happened. In the Euler case, this helps reveal the deeper issue behind donateToReserves(). The analysis shows that the attacker donated 100 million eDAI, which changed the relationship between eDAI and dDAI and made the position eligible for liquidation. The root cause was that donateToReserves() lacked a liquidity check for eligible liquidation, allowing the attacker to liquidate and extract value.
That is where Phalcon Debug becomes more than a viewer. It becomes a practical transaction analysis tool for finding root causes inside contract execution.
Debug View Sharing
Another useful feature is that a debug view can be shared directly by URL. The shared link includes the selected trace row, so when another user opens it, they see the same debug view immediately.
This is especially useful for security teams. Instead of writing a long explanation or asking a teammate to reproduce the same view manually, one analyst can share the exact context. That makes collaboration much faster during incident analysis or internal reviews.
A typical workflow looks like this. First, find a suspicious step in the Invocation Flow. Second, use debug mode to inspect code, internal calls, and parameters. Third, share the exact debug view with teammates so they can review the same context and continue the discussion.
Other Useful Features
Phalcon Debug includes a few extra features that improve analysis efficiency.
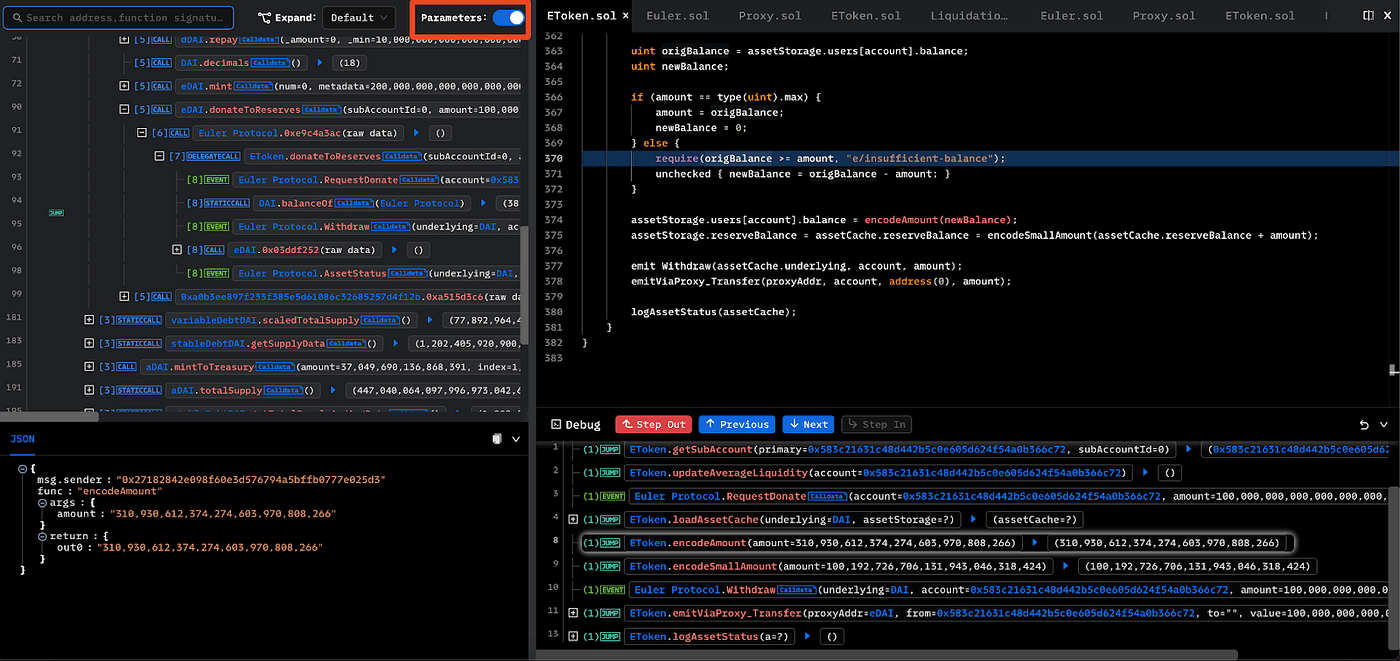
The Call Trace View can show full parameters when the parameter switch is turned on. That helps users inspect richer context without opening every step one by one.
For external calls, users can also click Rawdata to inspect the raw call parameters. This is useful when decoded data is not enough or when users want to verify how calldata was actually structured.
These details may seem small, but they save a lot of time during real analysis. For exploit investigation, audit work, or contract review, small workflow improvements often make a big difference.
For teams that want to go beyond one transaction and trace how assets moved across a broader attack path, MetaSleuth is a natural next step. It helps investigators follow funds across addresses and entities after the transaction-level root cause becomes clear.
Phalcon Debug is most useful when a transaction is too complex for a surface-level read but still needs a clear explanation. It helps users move from a suspicious trace entry to the actual code path, internal logic, and root cause. That makes it valuable not only for security research, but also for incident review, exploit analysis, and smart contract assessment. For teams that want to strengthen code before deployment, this same mindset naturally connects to Smart Contract Audit and Infrastructure Audits, where complex behavior is reviewed before it becomes a live risk.