On 20 July 2026 the Fun Coffee app stopped working, leaving several hundred investors in Hong Kong and Macau unable to recover either their principal or the returns the platform had promised. The company behind it, which advertised itself as a developer of high-technology coffee equipment with total assets above US$1 billion, was subsequently identified by Hong Kong and Macau police as a fraud operation. As of 19 August, Hong Kong Police had received 286 reports involving roughly HK$118 million.
Starting from one victim's payment records, we traced the funds forward on TRON and recovered a network of 99 addresses that received 72,829,035 USDT from outside and, as of our data cut-off, had moved all of it back out. What follows sets out the structure of that network, how we separated the money returned to investors from the money carried away, and where on-chain analysis reaches its limit.
A note on what follows. Chapter-one facts come from regulators, police and news media, and every page cited was opened and checked. Everything else is our own analysis of on-chain records, covering USDT on TRON only. Where we say what an address does, that rests on its behaviour on chain and on entity attribution in the BlockSec label database. It is not a finding about who controls the address, that person's state of mind, or legal liability. To protect the privacy of the victim whose material started this, we do not show their addresses, transaction hashes or platform screenshots, and we do not give their individual amounts.
The warnings came before the platform stopped
The public record has a shape worth noticing before any of the chain data.
On 15 May 2026, police in Khánh Hòa Province, Vietnam published a warning. It described advertised returns of 10% to 30% per month and a structure that pushed participants to recruit through multi-level "system commissions" and "team performance bonuses". It said plainly where the money came from: not from selling coffee, but from people who joined later.
On 13 July 2026, Hong Kong's Securities and Futures Commission added "Fun Coffee GCM 專案" to its Suspicious Investment Products alert list. The SFC recorded the operator and the promoter as the same entity, spanning Hong Kong and Vietnam. Its listing names the products the scheme advertised, including a high-efficiency cold-brew extraction system and a food-safety testing and traceability module, and notes that the material reached investors through marketing events held in Hong Kong.
On 20 July 2026, the app stopped working.
Hong Kong Police began receiving reports through July, after the shutdown, and ran a joint operation with the Macau Judiciary Police from 1 to 3 August, arresting six people in Hong Kong and two in Macau. Those arrested in Hong Kong were company directors, shareholders and core members responsible for promotion and recruitment. Roughly HK$610,000 was frozen.
The order, then, was regulatory warning, then shutdown, then criminal investigation. That sequence is used again later to explain an anomaly in the payout data.
The pitch itself was not complicated. The platform claimed total assets above US$1 billion and more than 5,000 staff. Hong Kong Police described three tiers, 啟航 (Launch), 成長 (Growth) and 遠航 (Voyage), advertising annual returns of roughly 197% to 278%. At the top tier, 29,800 USDT held for 570 days was supposed to return about HK$1 million in profit. Participants earned bonuses for bringing in friends and family, and Vietnamese police noted that the sales events taught attendees how to recruit.
Payment ran through crypto at every step. Once an investor registered on the app, customer service told them which wallet to send virtual assets to; only after that top-up could they invest. Macau worked a little differently: victims handed cash to shop staff, who helped them top up through a crypto account, with the money ending up in an account designated by the upline. That same upline also funded the shop's operations in crypto.
The network: four layers, one chokepoint, three exits
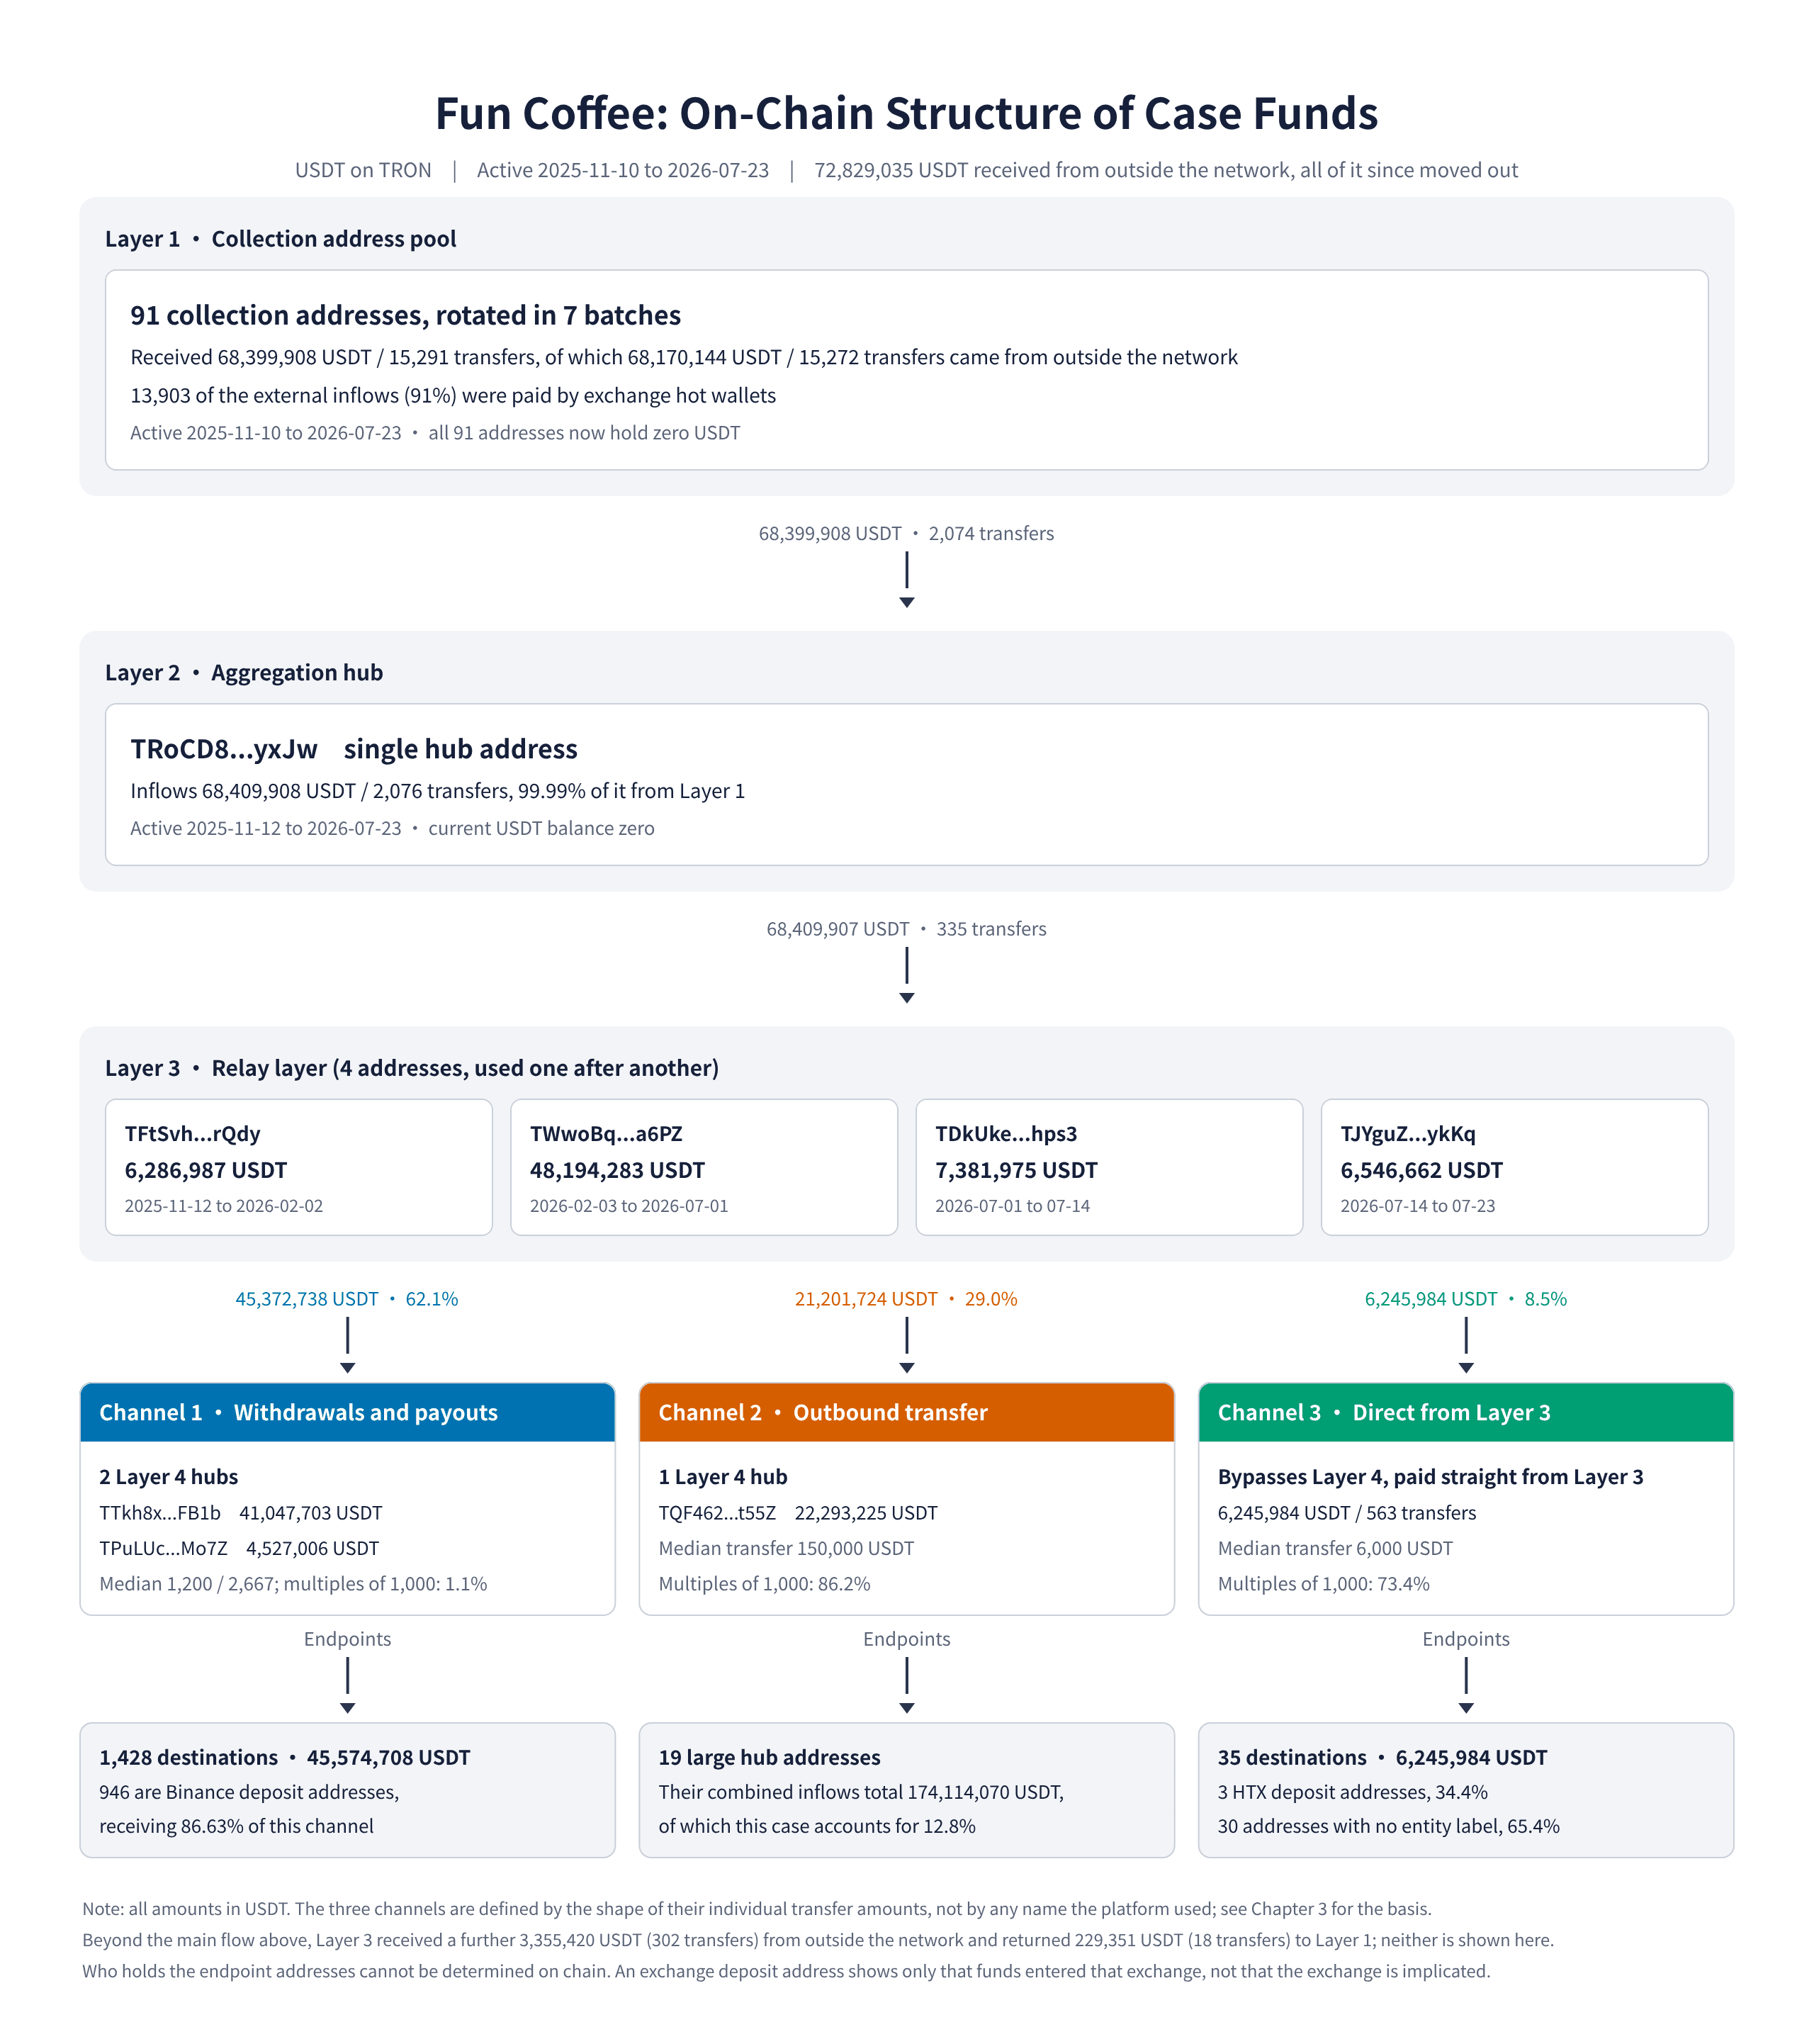
Queried one by one, those 99 addresses hold 1.52 USDT between them, and all 91 collection addresses are at zero. "Moved all of it out" is a measured result rather than a summary.
The 99 addresses fall into four layers, and they behave very differently from one another.
Layer 1 is a pool of 91 collection addresses, rotated in batches. The platform never published one fixed deposit address. Each of the 91 took between 67 and 649 incoming transfers from 9 to 38 distinct senders. Of the 15,272 inflows arriving from outside the network, 13,903 (91%) were paid by an exchange hot wallet, which matches the method police described: victims were told to send from wherever they held their crypto to a designated wallet.
Layer 2 is a single address. Everything Layer 1 collected converges on TRoCD8...yxJw, which received 68,409,908 USDT across 2,076 transfers, 99.99% of it from Layer 1, and forwarded all of it onward. It keeps nothing. This is the network's only chokepoint, and it is the reason a single victim's payments were enough to open up the whole structure.
Layer 3 is four relay addresses used one after another. The periods over which the hub funds them are consecutive and non-overlapping, with each handover falling on a single day. That looks less like four roles running in parallel and more like one role whose wallet was replaced three times.
| Relay address | From the hub | Period funded by the hub |
|---|---|---|
TFtSvh...rQdy |
6,286,987 | 2025-11-12 to 2026-02-02 |
TWwoBq...a6PZ |
48,194,283 | 2026-02-03 to 2026-07-01 |
TDkUke...hps3 |
7,381,975 | 2026-07-01 to 2026-07-14 |
TJYguZ...ykKq |
6,546,662 | 2026-07-14 to 2026-07-23 |
Layer 4 is three disposition hubs, and this is where the money splits by purpose. 91.1% of what leaves Layer 3 lands on these three addresses. Two of them ran consecutively, and the second, TPuLUc...Mo7Z, was active only between 15 and 23 July 2026, exactly the window in which the platform went dark and police started taking reports. It was the last address paying anyone.
Two details do not fit the tidy layer picture and should be stated. Not everything went down to Layer 4: 8.5% of Layer 3's outflows, 6,245,984 USDT across 563 transfers, left the network straight from Layer 3. And not everything came in through Layer 1: Layer 3 took a further 3,355,420 USDT across 302 transfers directly from outside the network, and the Layer 4 hubs took 1,293,472 USDT more between them, money that never touched a collection address.
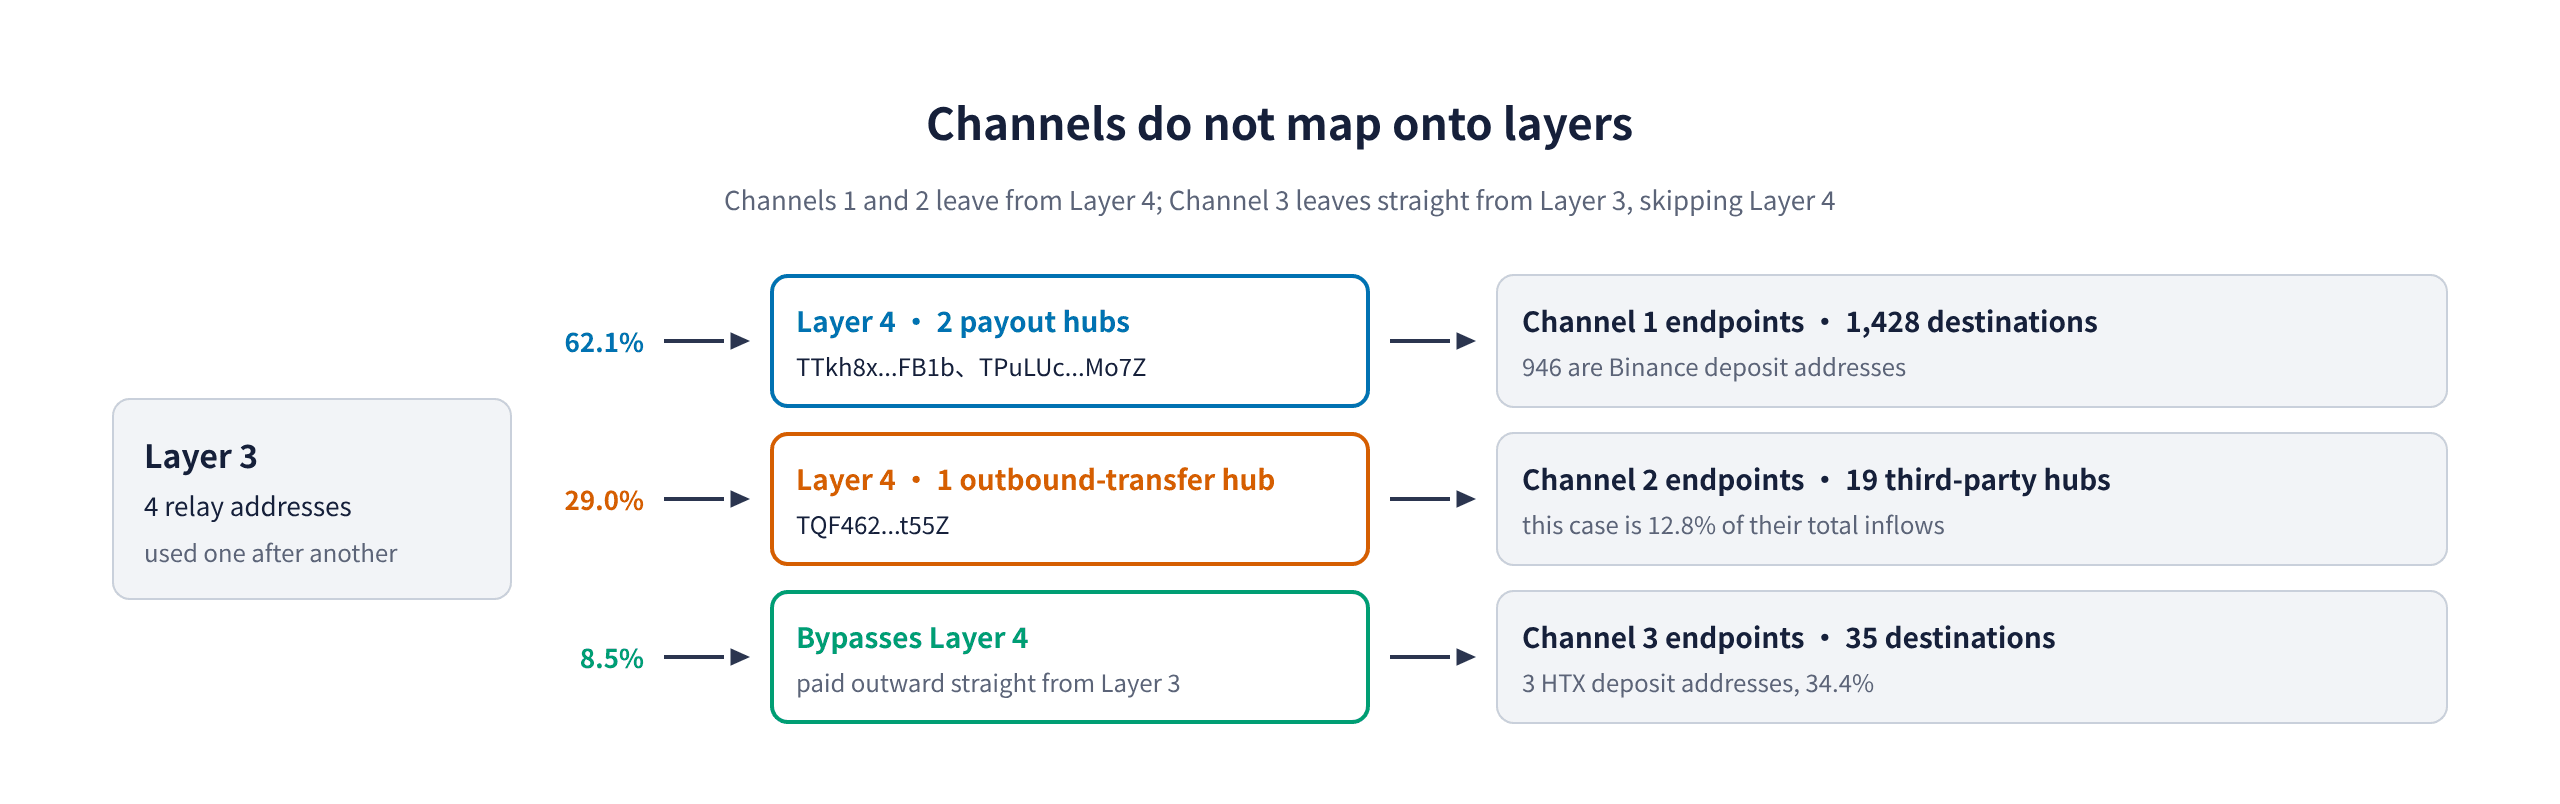
Whoever ran this did not route money strictly by layer. Layer 3 acted as a relay and simultaneously operated its own exit.
Round numbers separate the channels
The network has three exits. What each one was used for can be determined from the shape of its individual transfer amounts.
| Channel 1 | Channel 2 | Channel 3 | |
|---|---|---|---|
| Outgoing transfers | 11,612 / 920 | 87 | 563 |
| Median transfer | 1,200 / 2,667 | 150,000 | 6,000 |
| Largest transfer | 102,246 / 71,213 | 4,000,000 | 200,000 |
| Under 5,000 USDT | 81.9% / 73.1% | 16.1% | 29.7% |
| Multiples of 1,000 | 1.1% / 1.1% | 86.2% | 73.4% |
| Most frequent amounts | 300, 393, 448, 443, 324 | 150,000, 100,000, 300,000 | 5,000, 6,000, 10,000 |
The row on multiples of 1,000 separates them most sharply. Channel 1's transfers are almost never round: 1.1% are multiples of 1,000, and its most common amounts are figures like 393, 448 and 324. Channels 2 and 3 are round 86.2% and 73.4% of the time, in amounts like 150,000 and 5,000.
That difference follows from how each number gets produced. Paying a user their withdrawal or their interest means computing principal times a rate, which normally leaves an odd remainder. Moving money in bulk means a person typing a figure, and people type round figures.
This is a tendency, not a law. A platform can round its interest payments; someone moving funds can deliberately avoid round numbers. But the fit here is close enough to carry the classification, and it is supported by everything else about the three channels: Channel 1 made 12,532 small transfers to 1,428 destinations, while Channel 2 made 87 large ones to 19.
Channel 1 is the payout channel, 45,574,708 USDT going back out to investors and recruiters. 946 Binance deposit addresses took 86.63% of it; 451 self-custody addresses took 12.51%.
Channels 2 and 3 moved money out. Channel 2's 19 destinations are independently operating hubs that have taken 174,114,070 USDT in total across all their activity, of which this case is 12.8%. Channel 3 is the same profile one order of magnitude down, mostly to addresses we cannot attribute and to three HTX deposit addresses.
The address pool stopped growing while the money did not
Monthly inflows into Layer 1 rose every single month for nine months. No dips.
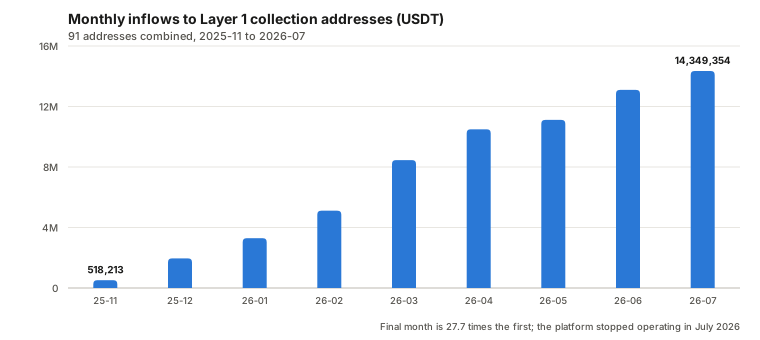
518,213 USDT in November 2025 rising to 14,349,354 USDT in July 2026, a factor of 27.7. The highest month is July, the month the platform stopped, so fundraising was still at its peak when it went dark.
The address pool did not track the money. No new collection addresses were activated at all in March or April 2026, and those were the two fastest-growing months. By July, 11 active addresses were handling 14,349,354 USDT, an average of 1,304,487 USDT each, 83 times the November figure. The pool was laid out in batches, 33 addresses at once in November 2025 and 20 at once in May 2026, and growth was absorbed by pushing more through each one. The month those first 33 went into service is the month the Macau shop opened.
The average transfer also grew, from 814 USDT to 6,882 USDT. This says more than the totals do: it was not only that more people joined, it was that each contribution was getting larger. Later participants were staking more per transaction than earlier ones.
How many people took part
Two independent routes land in about the same place, and both of them are floors.
Of the 15,272 inflows Layer 1 received from outside the network, 13,903 came from 15 addresses labelled as belonging to exchanges, each of which sits in front of many retail senders we cannot tell apart. The remaining 1,369 came from 175 self-custody addresses, an average of 7.8 transfers each. Extrapolate the exchange side at that rate and you get about 1,777 people; add the 175 and it comes to roughly 1,950.
From the other end: Channel 1 paid 1,428 destination addresses, and 86.3% of the self-custody contributors received a payout at some point. Applying that rate in reverse gives about 1,655.
So 1,650 to 1,950, and probably more than that. Most self-custody addresses paid in once or twice, but a few paid in dozens of times and one more than two hundred, which looks less like a person than like a recruiter topping up for their downline. An average is the right tool for turning a transfer total into a headcount, but those high-frequency addresses pull the average up and push the headcount down. Estimated from the frequency an ordinary participant actually shows, the number could reach the order of 7,000. Three other things point the same way: one person may hold several addresses; anyone who never withdrew appears nowhere in the payout channel; and there is a funding route that skips Layer 1 altogether, paying from an HTX hot wallet straight into Layer 3 (110 transfers, 240,824 USDT).
A headcount is not a victim count. The addresses receiving payouts hold at least three kinds of party mixed together and the chain does not separate them: ordinary investors who collected less than they put in, recruiters earning multi-level commission, and possibly the operators' own cash-out accounts, which cannot be ruled out precisely because those Binance deposit addresses cannot be attributed to anyone.
Most of the participants we can trace individually did recover their money
The findings in this section apply only to participants who can be identified individually on chain, so that group needs defining first. There is a subset we can measure: those who paid in from a wallet they control, rather than through an exchange. When someone pays from an exchange account, the sender on chain is the exchange's hot wallet, shared by thousands of customers, and no single payment can be tied to a person. When they pay from their own wallet, it can.
After excluding addresses belonging to the network itself and dust-level contributions under 100 USDT, 175 addresses remain. Of these, 151 (86.3%) received money back; together they contributed 6,211,277 USDT and received 7,830,067 USDT, a recovery rate of 126.1%, with 110 recovering 100% or more. As a group they came out ahead. A further 24 received nothing at all after contributing 466,630 USDT between them.
Grouped by month of first contribution, there is no downward trend. Median recovery by month bounces between 75.0% and 183.2%, and the November 2025 cohort, the earliest, sits at 113.4%. The familiar story of a Ponzi, early joiners doing fine and late joiners wiped out, does not appear in this sample.
This returns to the timeline set out earlier. The scheme did not run out of money: it raised more in its final month than in any month before it. What stopped it was a foreign police warning in May and a regulatory listing on 13 July, followed by the shutdown on 20 July, with the criminal investigation beginning only afterwards. A scheme interrupted while it is still solvent has not yet reached the stage at which it stops paying people.
This also explains how something advertising 278% a year survived for close to a year. Early participants really did get paid, and their experience is what recruited the next round. Hong Kong Police described the same mechanism from the victim side: participants saw others succeed, received small returns themselves, believed the scheme was genuine, dropped their guard, and increased their investment.
The 126.1% recovery rate does not represent participants as a whole
The limits are twofold: how much of the payout channel this sample covers, and who is in it.
First, it only covers 12.51% of the payout channel. The method needs a comparable contribution on chain, which only self-custody addresses have. The 946 Binance deposit addresses that took 86.63% of Channel 1 are outside it entirely. By transfer count, 91% of Layer 1's inflows came through an exchange.
Second, this group being net positive is exactly why it is unrepresentative. People who use self-custody wallets in a scheme like this tend to be more active, to move more, and to have joined earlier. A substantial share of them are recruiters, not investors. We can see the pattern directly: one address paid in 581 USDT and received 100,434 USDT, a factor of 173, and there are others at 100x and 75x. Any loss estimate built on this sample understates the real figure systematically.
We should be careful even about calling those recruiters. Receiving far more than you paid in looks identical on chain whether you were earning recruitment commission or you were an early investor who took profits and left. That pattern alone cannot separate the two, so we do not make the finding about any specific address.
The victim whose records started this analysis provides a direct contrast. All of their contributions went through an exchange account, so they are not among the 175, and their cumulative payouts came to roughly 3.8% of what they contributed, two orders of magnitude away from the sample's 126.1%. A single case is not statistical evidence, but it points the same way as the bias: the people we cannot see individually may have done far worse than the people we can.
How much participants actually lost
Three different figures are commonly described as "the loss". Only one of them is suited to a loss claim by participants.
The platform's own books are the cumulative "amount invested" the app displayed. That figure includes reinvested paper profits and tier bonuses, so it is materially larger than what anyone actually paid in. It should not be used.
Cumulative on-chain receipts are what the collection addresses took in from outside the network: 68,170,144 USDT. This figure is evidenced and defensible, but it is not what participants lost. In a Ponzi the same money cycles between contribution and payout more than once, so the cumulative figure runs above the real net loss. And whether some of it is money the operators injected themselves to manufacture apparent volume cannot be told from the chain.
Net loss is the amount participants lost in aggregate, and it is the only one of the three suited to a loss claim.
Because the network has emptied itself out, there is an identity available:
total contributions = amounts returned to participants + amounts taken by the operators + funds left in the network (≈ 0)
Which means the aggregate net loss equals what the operators took. Channels 2 and 3 qualify: large round transfers into hubs and exchange deposit addresses that simultaneously pool substantial money from elsewhere, with none of the characteristics of paying users one at a time.
| Channel | Sent outside the network |
|---|---|
| Channel 2 | 21,193,224 USDT |
| Channel 3 | 6,245,984 USDT |
| Lower bound on net loss | 27,439,208 USDT |
(Channel 2's figure is what actually left; 1,100,002 USDT of its hub volume came back to Layer 3 and never departed.)
There is no upper bound we can give. It would be this number plus however much of the 45,389,827 USDT Channel 1 sent out of the network went to the operators' own cash-out accounts rather than to real investors, and that depends on how many of those 946 Binance deposit addresses belong to the operators. An exchange deposit address maps to one exchange account, but who holds it, and whether they also paid money into the platform, is not on the chain. Only the exchange's own records can settle it. This report therefore gives a lower bound, with no upper bound and no point estimate.
Even the lower bound carries one assumption, which is that Channel 3's destinations really sit outside the network. Of the 1,636 external addresses that transacted with these 99, 160 did so in both directions, paying money in as well as taking it out. Some of those may functionally belong to the same operation and simply fell outside the boundary this analysis drew. If later work brings them inside it, both Channel 3's outbound total and this lower bound come down.
What the chain settled, and what it did not
Starting from one victim's payments, the chain yielded the shape of the whole operation: 91 rotating collection addresses, a single chokepoint, four relays used in sequence, three exits with distinguishable purposes, and 27.4 million USDT that can be shown to have been carried away rather than paid back.
What it could not yield is identities. The 946 exchange deposit addresses holding 86.63% of the payouts are the boundary. Past that point the question stops being an analytical one and becomes a matter of records held by exchanges, which is where this kind of case has to go next.
Sources
Every item in the background section was verified against the original page. Titles are in their original language.
| Body | Title | Date |
|---|---|---|
| Securities and Futures Commission, Hong Kong | Fun Coffee GCM 專案 | 2026-07-13 |
| Public Security Dept., Khánh Hòa, Vietnam | Cảnh báo: bẫy lợi nhuận "khủng" từ mô hình đầu tư chuỗi cửa hàng "Fun Coffee" | 2026-05-15 |
| RTHK | 警方破 FUN COFFEE 投資騙案 225 宗案涉款逾 9 千萬元 | 2026-08-04 |
| RTHK | 警方:FUN COFFEE 騙案涉案總損失增至約 1 億 400 萬元 | 2026-08-05 |
| Judiciary Police, Macau | 港澳警方「峻立行動」搗破投資咖啡詐騙集團 共拘 8 人 | 2026-08-05 |
| VietnamPlus | Trung Quốc: Cảnh sát Hong Kong, Macau triệt phá vụ lừa đảo đầu tư Fun Coffee | 2026-08 |
| Oriental Daily (on.cc) | Fun Coffee投資騙局涉款近億元 其中 6 名在港被捕人准保釋候查 | 2026-08-05 |
| am730 | 港澳警搗破 Fun Coffee 騙局 涉款近億 8 人落網 | 2026-08-05 |
| Sing Tao Daily | Fun Coffee 投資騙局 警方接獲 286 宗報案 涉款高達 1.18 億元 | 2026-08-19 |
Two notes on the sources. Hong Kong's report count exists at three points in time (225 reports and about HK$94 million on 3 to 4 August; 255 and about HK$104 million on 5 August; 286 and about HK$118 million on 19 August); we use the most recent. On the shutdown date, VietnamPlus reports 20 July while the Macau Judiciary Police describe victims noticing problems on 22 July; these are the shutdown and the discovery, and they do not conflict.
Scope: USDT on TRON. Transaction data through 24 August 2026; balances queried 25 August 2026; public sources verified 25 August 2026. Percentages are on amounts unless given as address counts. Addresses with no attribution in the label database are described as having no entity label, which records only that we could not identify them.