Phalcon Debug 使交易分析变得更加容易,尤其是在交易过于复杂而无法仅从表面视图理解时。它允许用户深入执行流程,检查已验证的代码,并详细了解内部逻辑,而不是停留在高级交易跟踪。这使其在漏洞分析、根本原因调查和团队协作方面特别有用。
在本指南中,我们将以 Euler 协议漏洞交易 为例。目标是展示 Phalcon Debug 如何帮助用户从可疑的交易步骤转向对发生了什么以及为什么重要的问题的清晰解释。
您可以在此处直接打开交易:Phalcon 交易页面
如何进入调试模式
在 Phalcon 中进入调试模式主要有两种方式。
第一种是从“调用流”视图中的特定行进入。第二种是通过交易页面右上角的“调试”按钮进入。两者都导向相同的调试环境,但当您已经看到一个可疑的步骤并希望立即深入研究时,从“调用流”开始通常更有用。
在 Euler 漏洞示例中,该交易包含许多步骤,包括从 Aave 借入闪电贷并将 DAI 存入 Euler。一个特别可疑的步骤是调用 donateToReserves(),攻击者向该协议捐赠了巨额款项。这种行为通常值得深入审查,而 Phalcon Debug 允许用户从那里开始分析。
调试视图布局
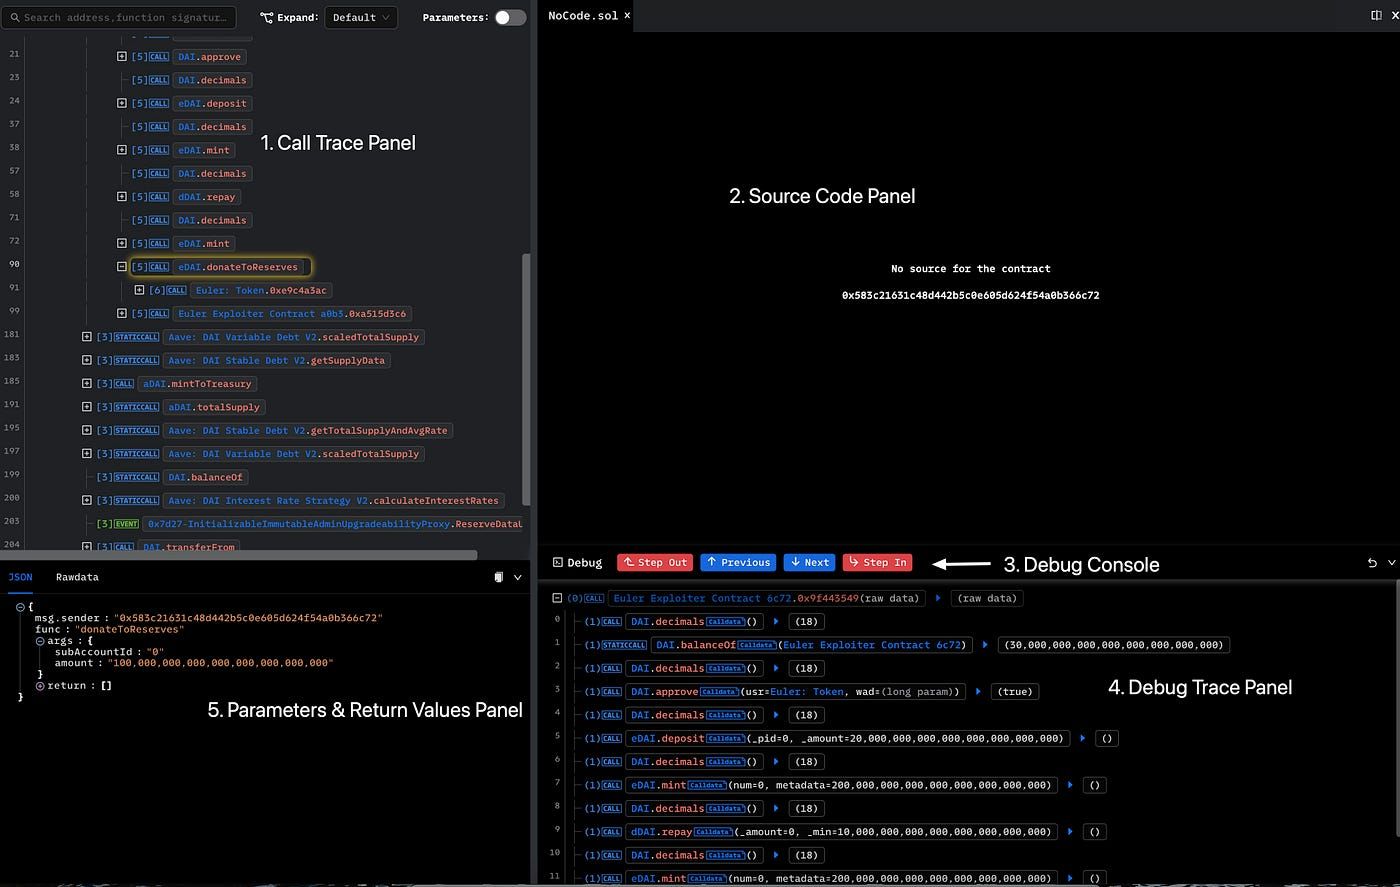
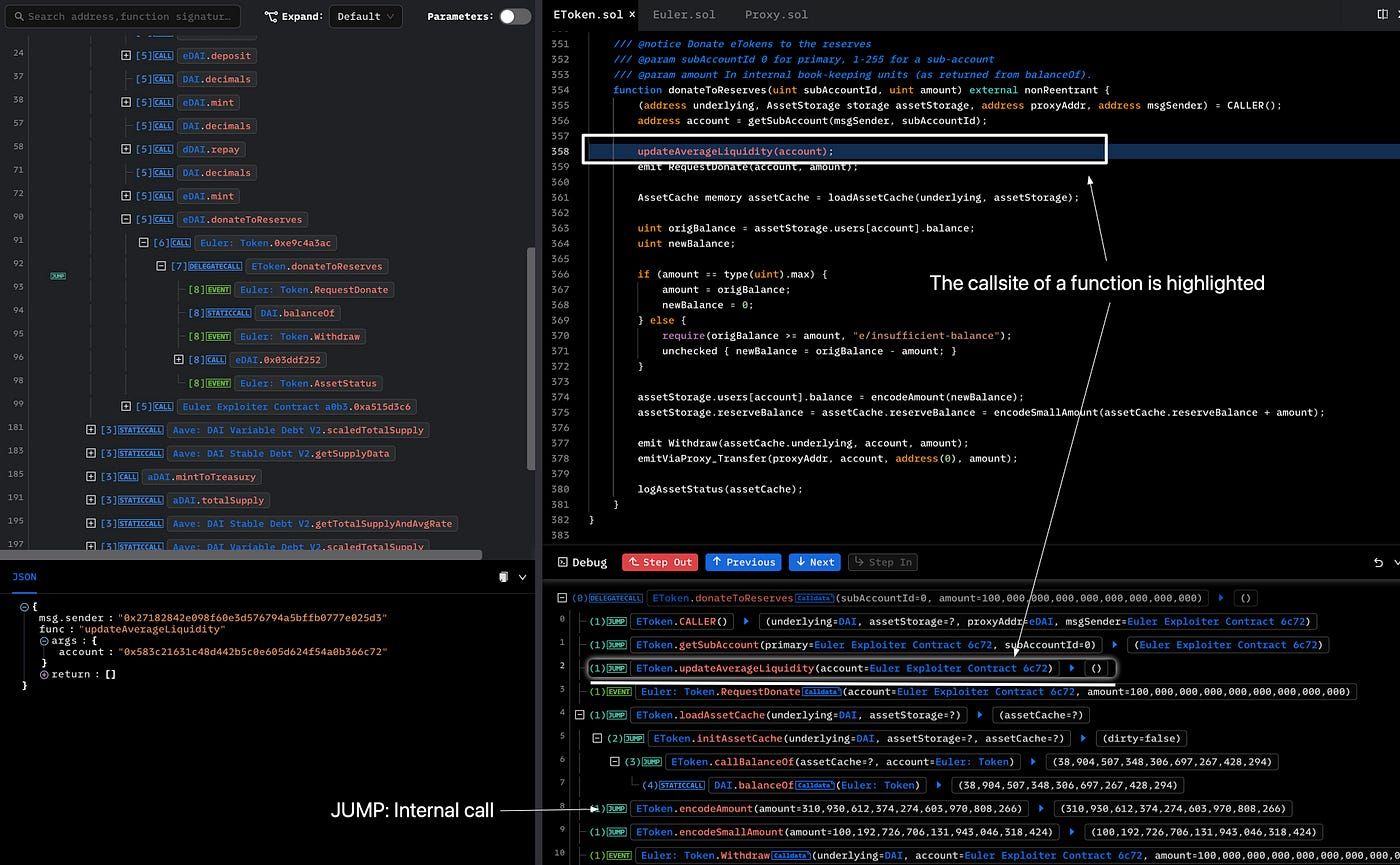
进入调试模式后,Phalcon 会显示一个为分步交易分析而构建的工作区。布局包含五个核心面板。
“调用跟踪面板”显示外部调用和事件的跟踪。“源代码面板”显示当前合约的源代码并高亮显示相关行。“调试控制台”提供按调用级别进行单步控制。“调试跟踪面板”显示当前合约调用堆栈,包括内部和外部调用。“参数与返回值面板”显示当前调用的输入和输出。
这种布局很有用,因为用户无需在多个工具之间跳转即可理解交易的某一部分。他们可以在一个地方阅读跟踪、检查代码并遵循执行逻辑。
有时源代码面板可能不显示代码。这通常发生在当前调用指向一个未经验证的合约时。在此 Euler 案例中,攻击者合约未经验证,因此源代码不可用。但是 eDai 合约已验证,这意味着用户可以“进入”并继续分析已验证的逻辑。
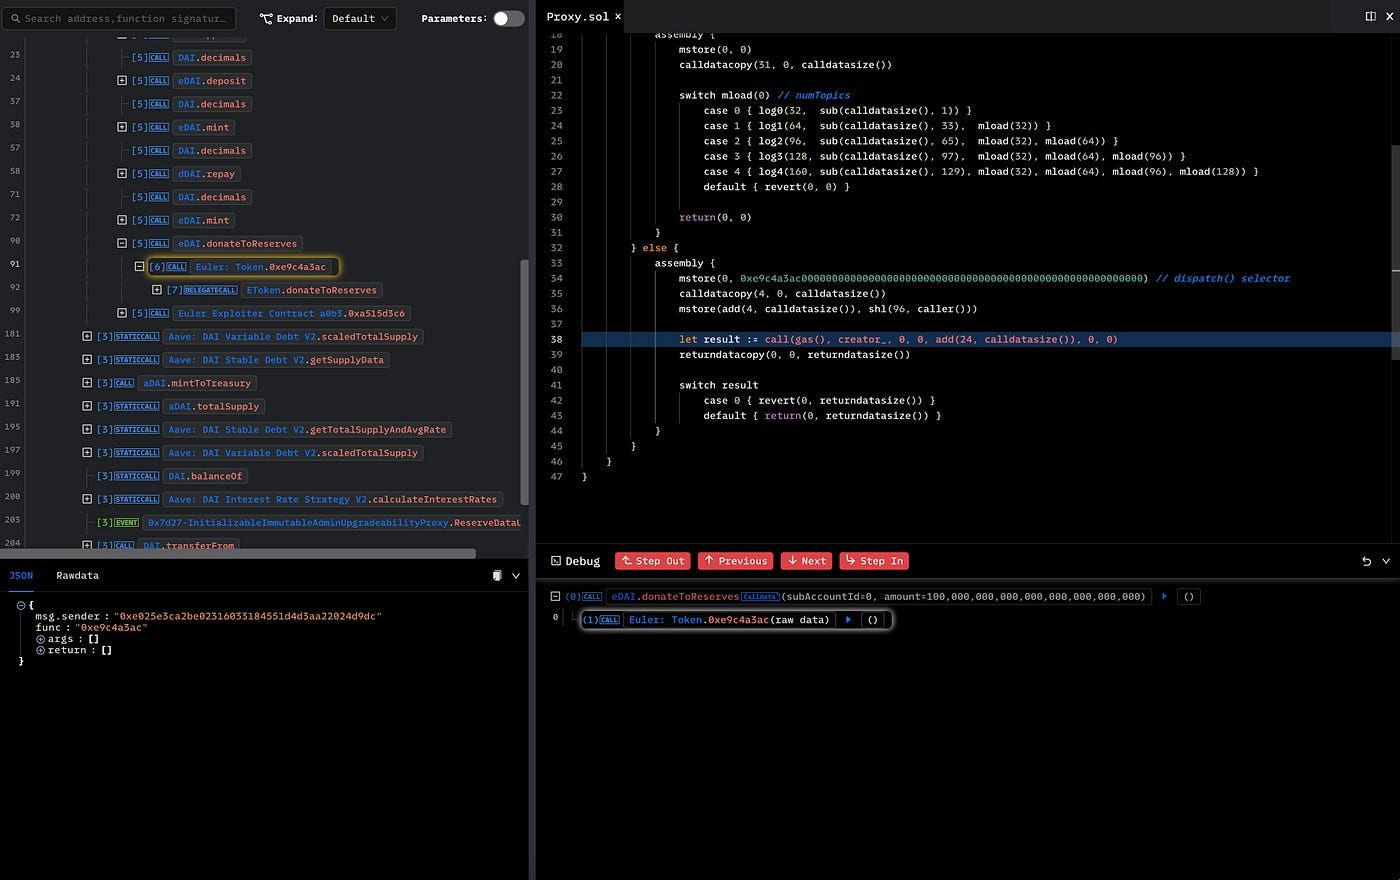
在进入已验证的 eDai 合约后,用户可以进一步深入 donateToReserves() 的实现,并检查可疑交易步骤背后的确切代码路径。
如何使用调试控制台
调试控制台旨在帮助用户详细地逐行了解交易执行过程。这很重要,因为“调用跟踪面板”只显示外部调用和事件。它不显示内部函数调用。调试控制台填补了这个空白。
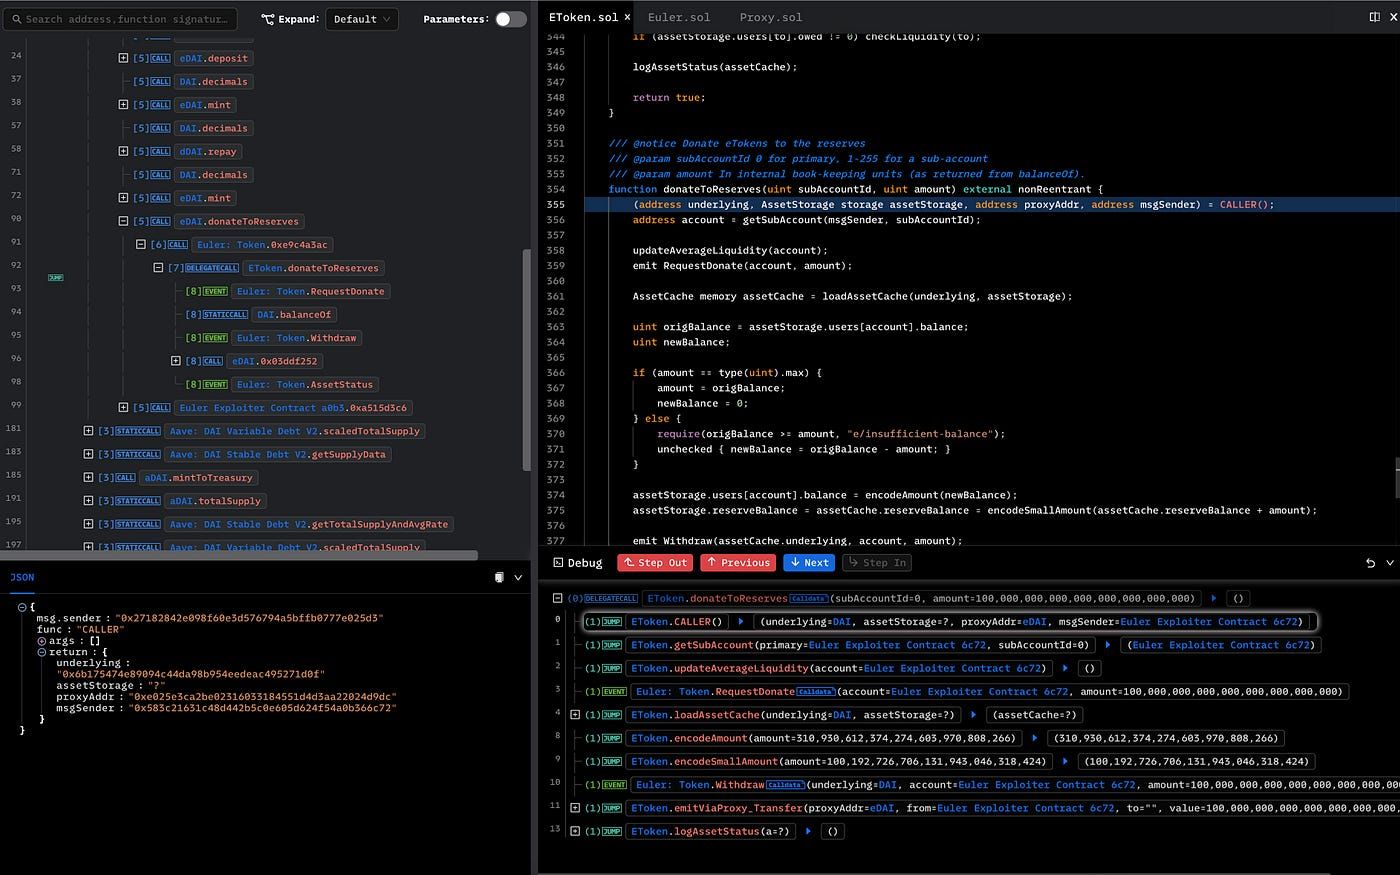
Phalcon 在此面板中提供了一些导航控件。“下一步”和“上一步”各有两个版本。红色按钮用于遍历完整的调用跟踪,而蓝色按钮用于在当前函数内部移动。“进入”将进入被调用的函数。“退出”将返回到当前函数的调用站点。
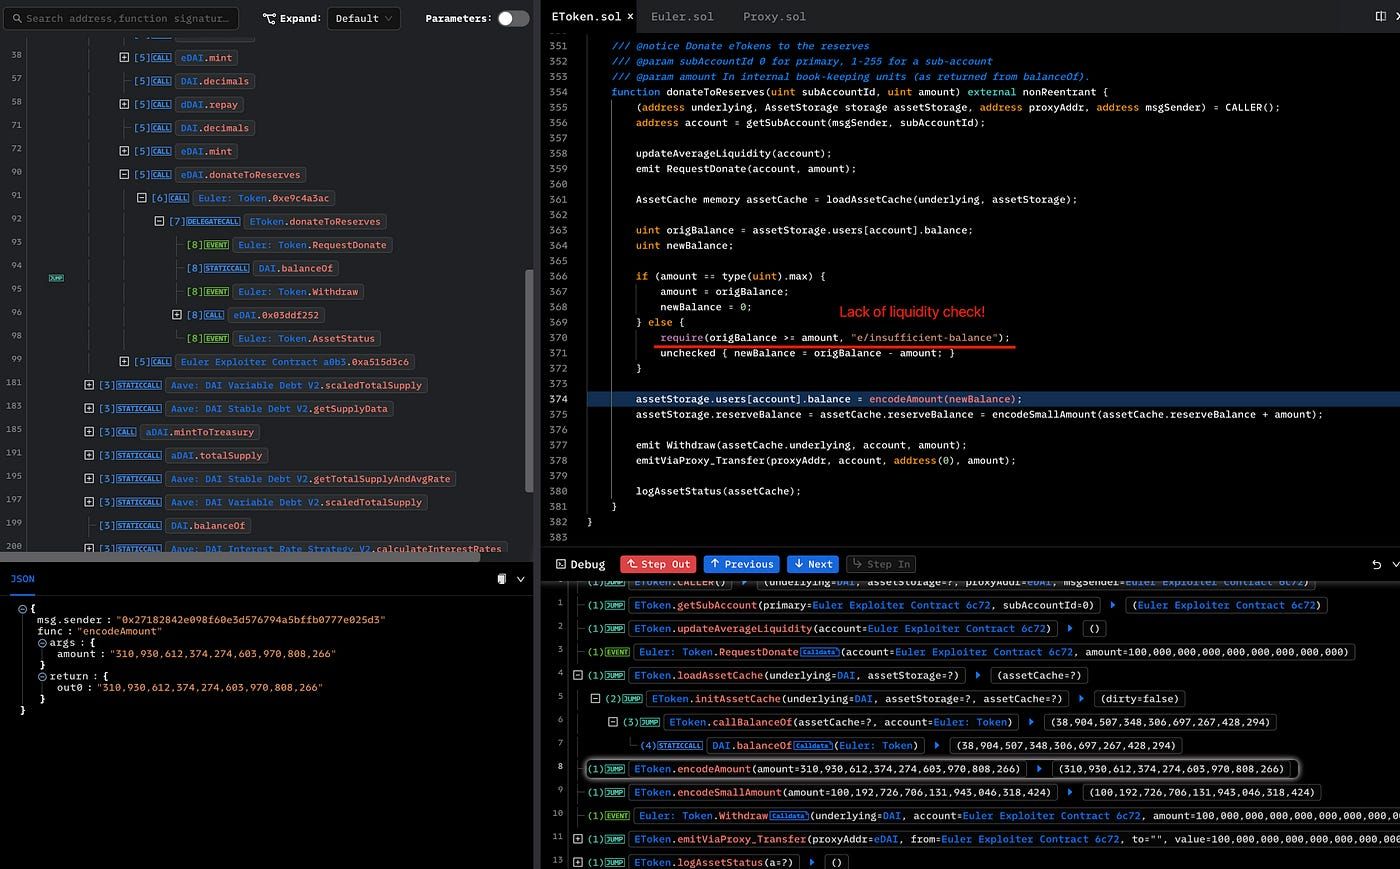
通过这些控件,用户可以逐行浏览合约逻辑,并了解状态是如何变化的。在 Euler 案例中,这有助于揭示 donateToReserves() 背后的深层问题。分析表明,攻击者捐赠了 1 亿 eDAI,这改变了 eDAI 和 dDAI 之间的关系,并使该头寸有资格被清算。根本原因是 donateToReserves() 缺乏针对合格清算的流动性检查,从而允许攻击者进行清算并提取价值。
这就是 Phalcon Debug 不仅仅是一个查看器。它变成了一个实用的交易分析工具,用于在合约执行中查找根本原因。
调试视图共享
另一个有用的功能是可以通过 URL 直接共享调试视图。共享链接包含选定的跟踪行,因此当另一个用户打开它时,他们会立即看到相同的调试视图。
这对于安全团队尤其有用。分析师无需编写冗长的解释或要求同事手动重现相同的视图,就可以共享确切的上下文。这在事件分析或内部审查期间大大加快了协作速度。
典型的流程如下。首先,在“调用流”中找到一个可疑的步骤。其次,使用调试模式检查代码、内部调用和参数。第三,与同事共享确切的调试视图,以便他们可以审查相同的上下文并继续讨论。
其他有用功能
Phalcon Debug 包含一些额外的功能,可提高分析效率。
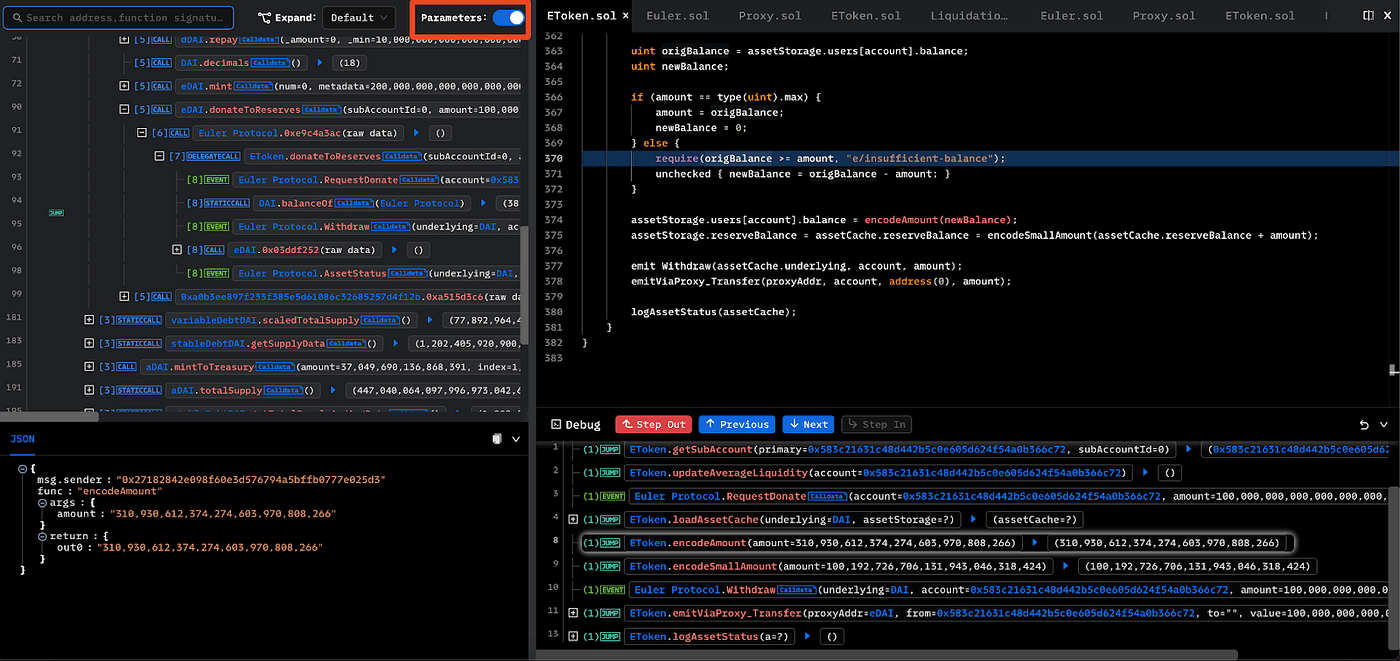
当参数开关打开时,“调用跟踪视图”可以显示完整的参数。这有助于用户在不逐个打开每个步骤的情况下检查更丰富的上下文。
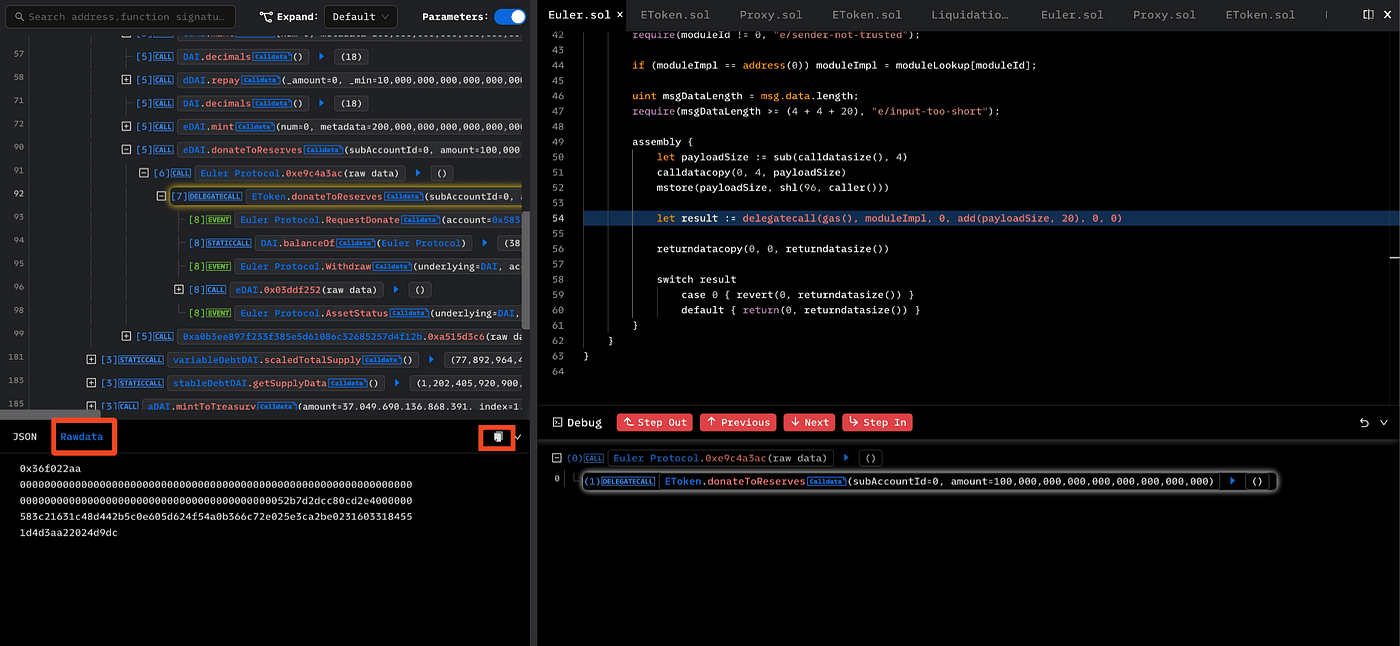
对于外部调用,用户还可以点击 Rawdata 来检查原始调用参数。当解码数据不够用时,或者当用户想验证调用数据实际是如何构造的,这会很有用。
这些细节可能看起来微不足道,但在实际分析中却节省了大量时间。在漏洞调查、审计工作或合约审查中,工作流程的小改进通常会带来巨大的差异。
对于希望超越单个交易并在更广泛的攻击路径中跟踪资产流动的团队来说,MetaSleuth 是一个自然的下一步。在了解了交易级别的根本原因后,它可以帮助调查人员跟踪跨地址和实体的资金流。
当交易过于复杂而无法进行表面阅读,但仍需要清晰的解释时,Phalcon Debug 最为有用。它帮助用户从可疑的跟踪条目转到实际的代码路径、内部逻辑和根本原因。这使其不仅对安全研究有用,而且对事件审查、漏洞分析和智能合约评估也很有价值。对于希望在部署前加强代码的团队来说,这种思维方式自然会与 智能合约审计 和 基础设施审计 联系起来,在这些审计中,复杂的行为会在成为实际风险之前得到审查。