We were thrilled to receive so much positive feedback and engagement from both longtime users and new followers after launching our 7 Days of Phalcon journey on Twitter. We’re proud that Phalcon has solved real-world problems for so many users, such as Phalcon providing the jump-level debug to analyze the transaction and intuitive before-and-after comparisons of transaction states, etc.
Now, we’ve compiled the features we highlighted during the journey. We want to emphasize that Phalcon offers far more than just these 7 features — there are countless possibilities waiting for you to explore.
So let’s dive in and explore!
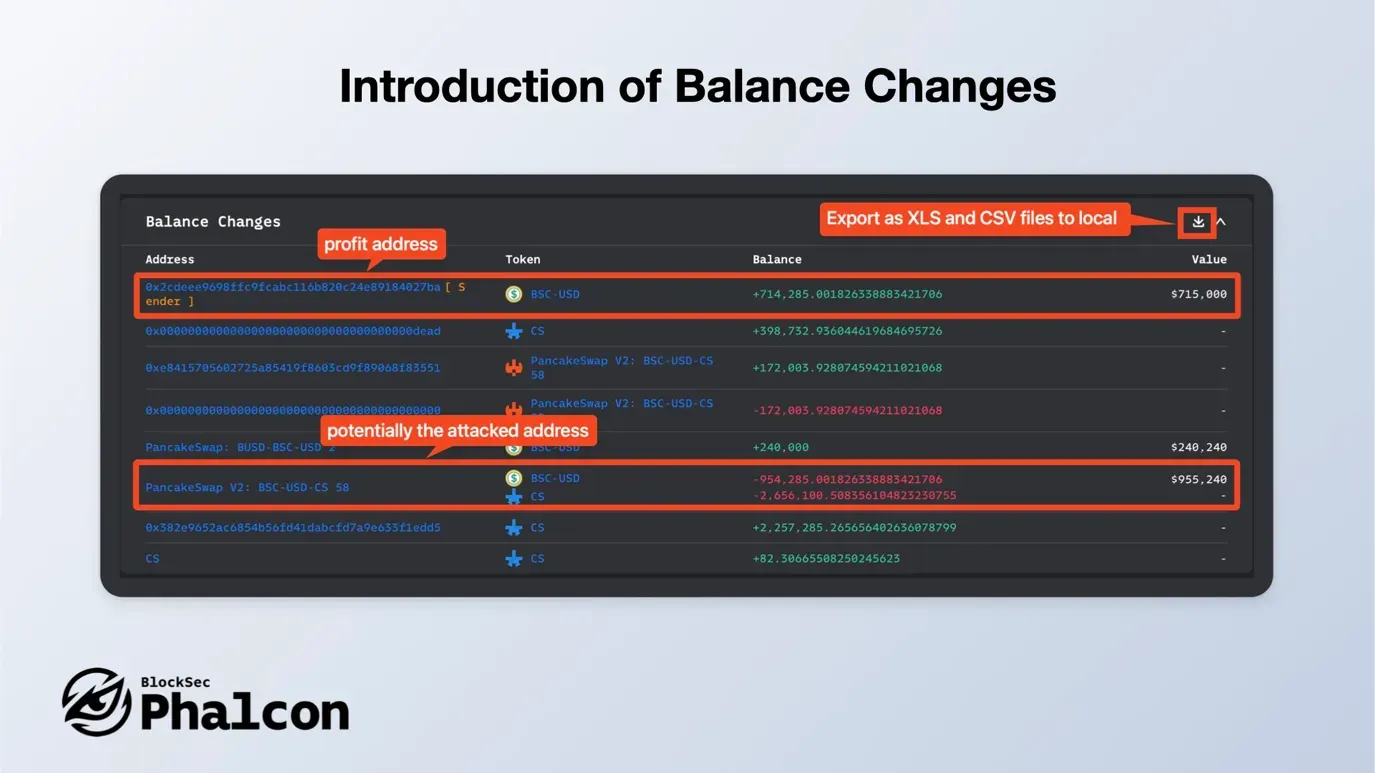
Feature 1: Presenting Balance Changes
Track asset shifts across all transaction addresses with our ultimate tool. It provides a clear summary of token variations and calculates the USD value for mainstream tokens. Check your results on our webpage or export them as XLS/CSV files.
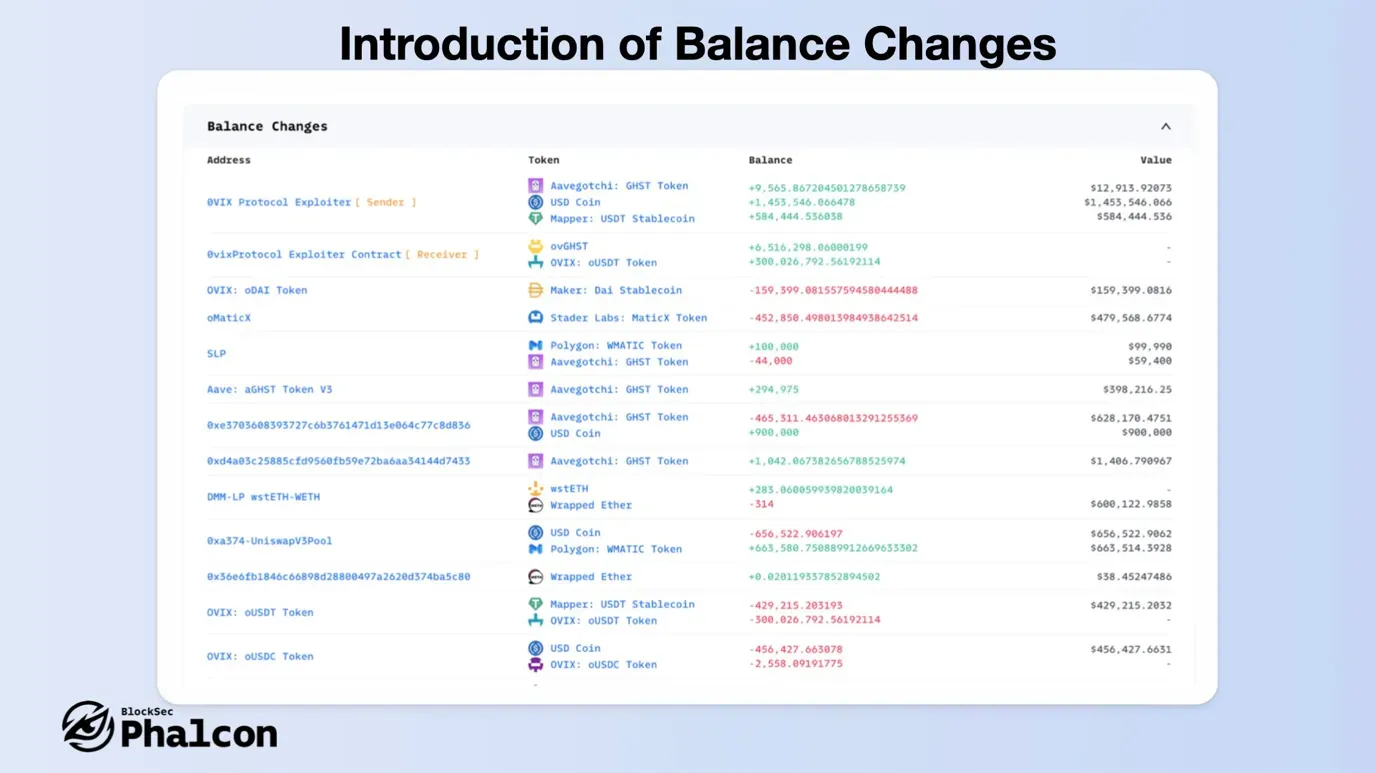
Ideal for developers debugging contracts and security researchers probing attack transactions, Balance Changes simplifies asset variation analysis and pinpoints affected or profitable addresses.
See it in action: Related Link
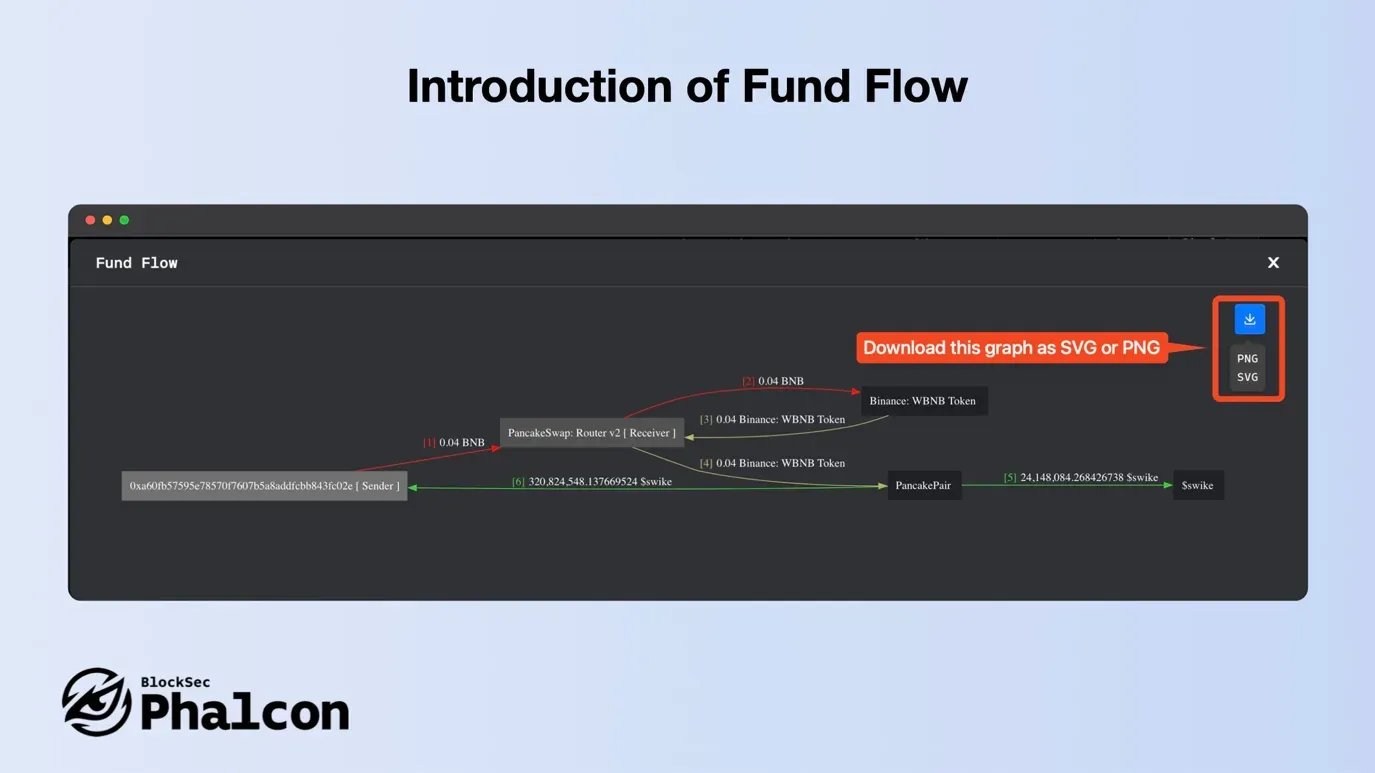
Feature 2: Presenting Fund Flow
Visualize token transactions as directed graphs with our tool, Fund Flow. Nodes represent unique addresses and are color-coded as senders and recipients. Edges detail transfer direction, tokens, and amount, making transactions transparent and intuitive.
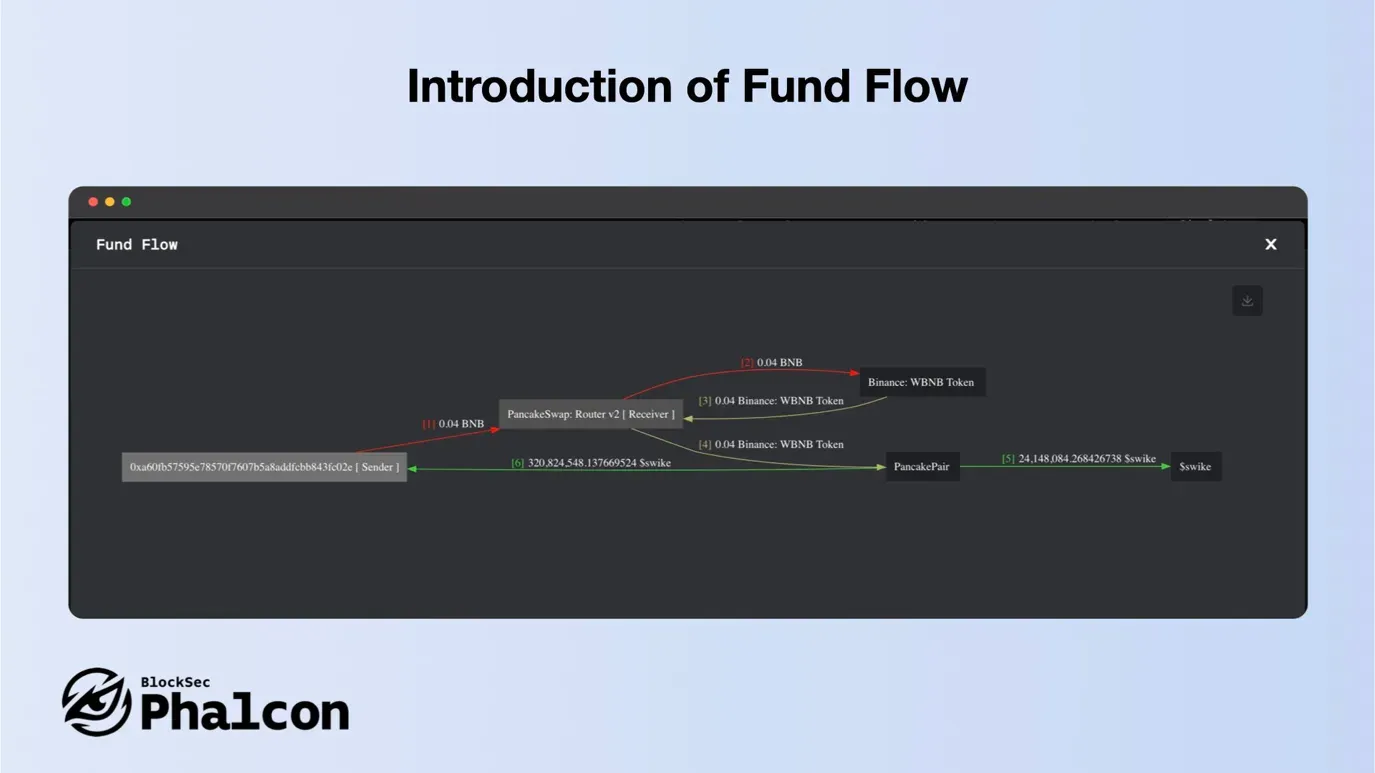
With Fund Flow Feature of Phalcon, edges have serial numbers for chronology, colors for token types, and identical flows are merged for simplicity. View the finer details or the broader picture with the zoom feature, and download this graph as SVG or PNG for anytime access.
See it in action: Related Link
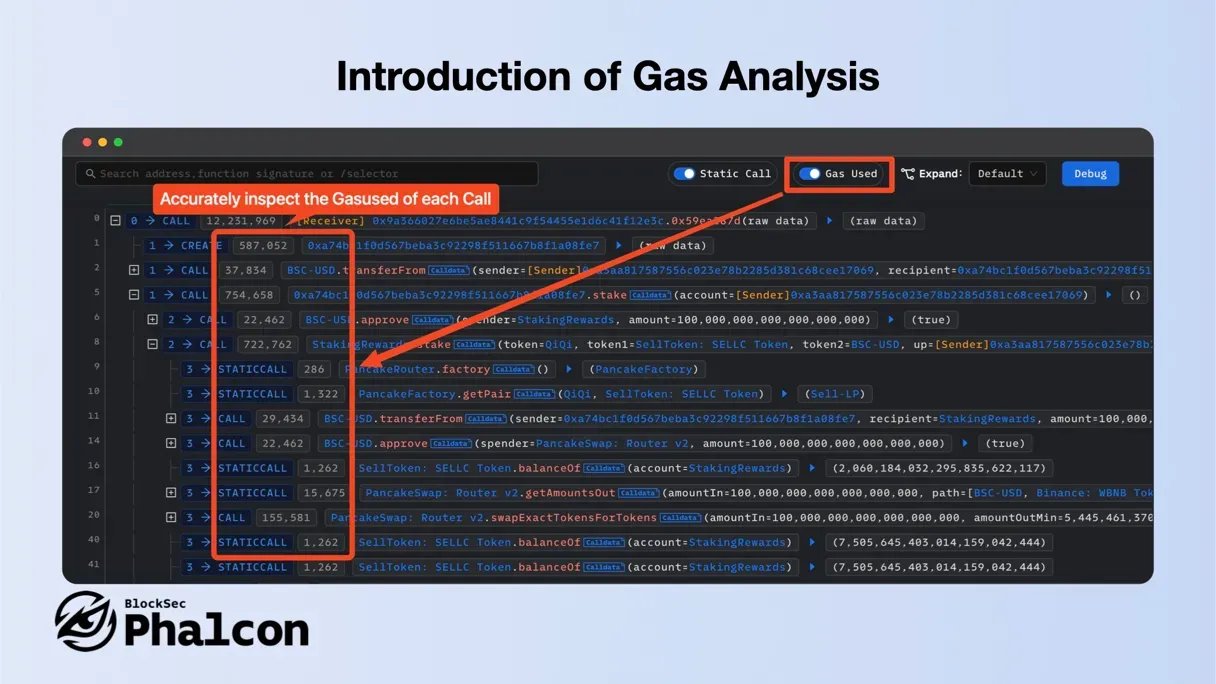
Feature 3: Presenting Gas Analysis
Phalcon’s Gas Analysis tool allows for precise inspection of each call’s Gas consumption and offers fast, intuitive analysis via flame graphs. This invaluable feature is a must-have for security researchers and developers.
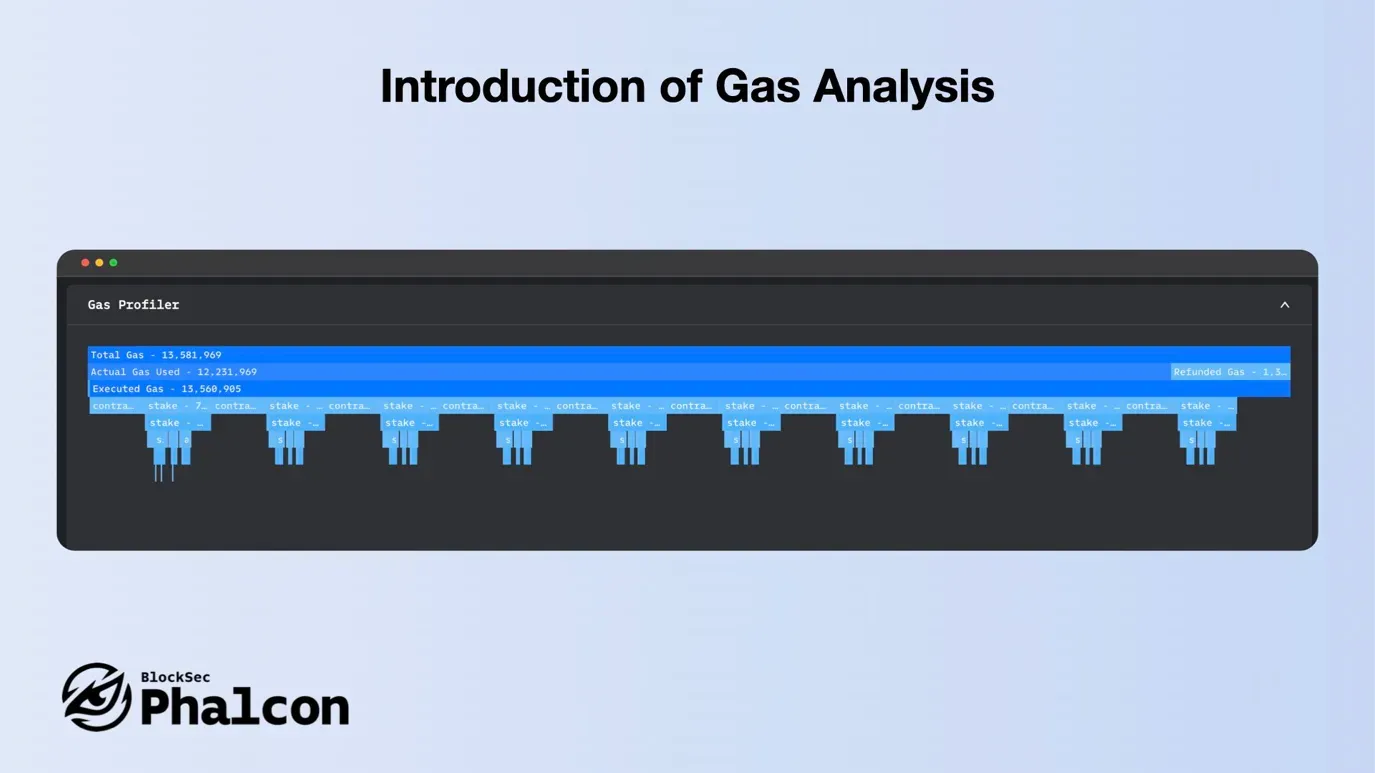
With Gas Analysis Feature of Phalcon, developers can optimize and reduce gas usage, lowering transaction execution costs. For security researchers, the core attack logic in complex attack transactions is often the most gas-consuming.
See it in action: Related Link
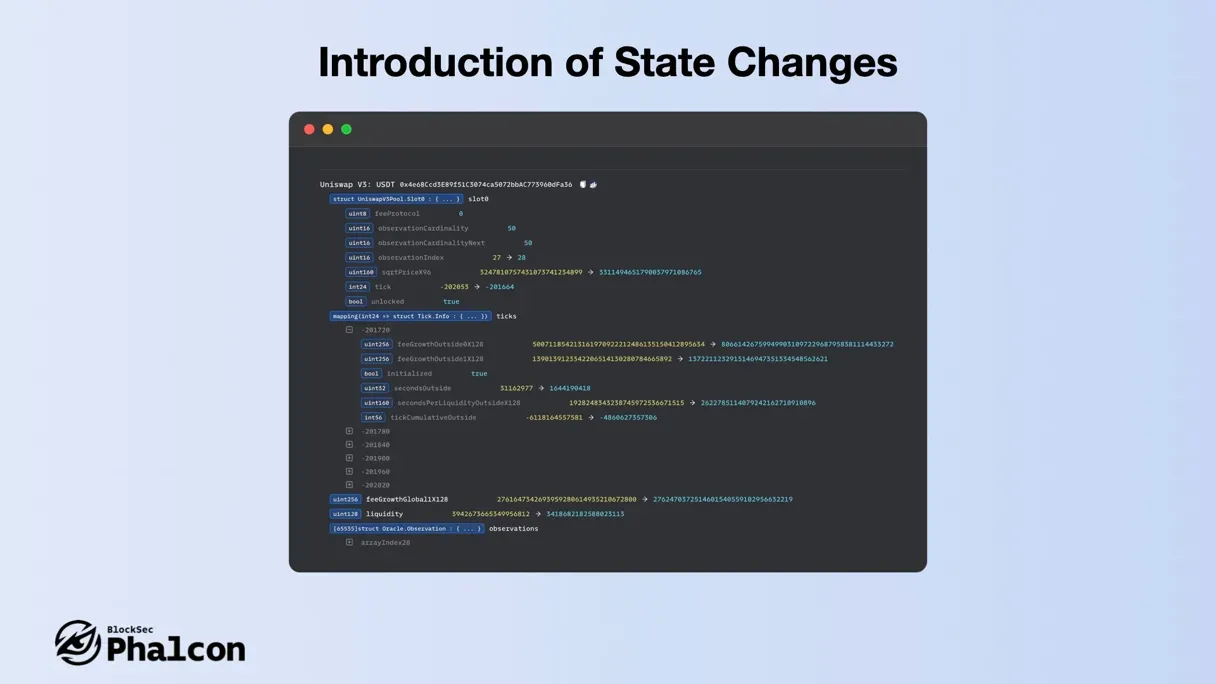
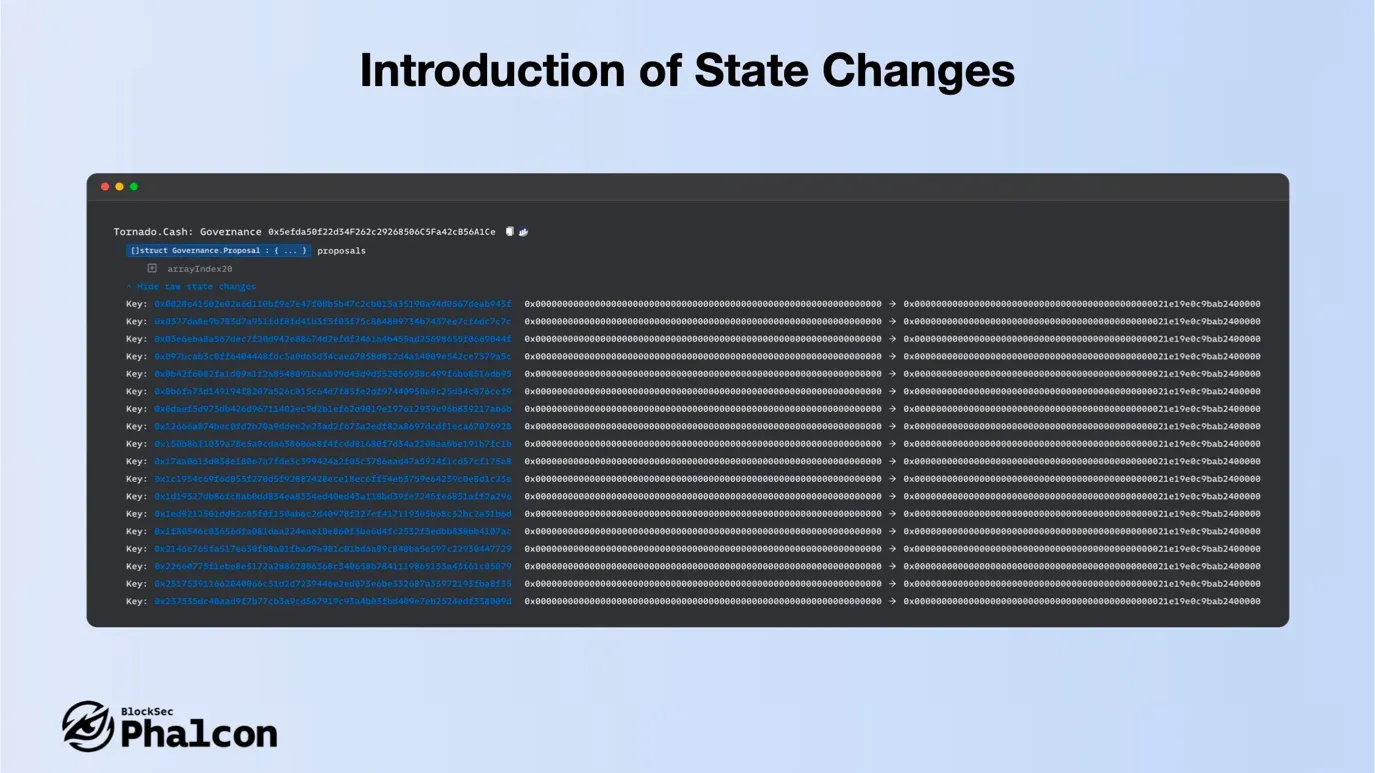
Feature 4: Presenting State Changes
Phalcon analyzes state changes before and after transactions, providing insights into these changes with parsing reliability and accuracy that far surpass other tools.
In the recent Tornado Cash Dao attack incident, using State Changes can quickly detect malicious proposals to directly change the locked Balance in Governance for 100 addresses.
See it in action: Related Link
Feature 5: Presenting Invocation Flow
Phalcon provides a tree-structured sequence of function calls in transactions. We’ve developed many tools to boost analysis efficiency for developers and security researchers. Let’s Dive into the details!
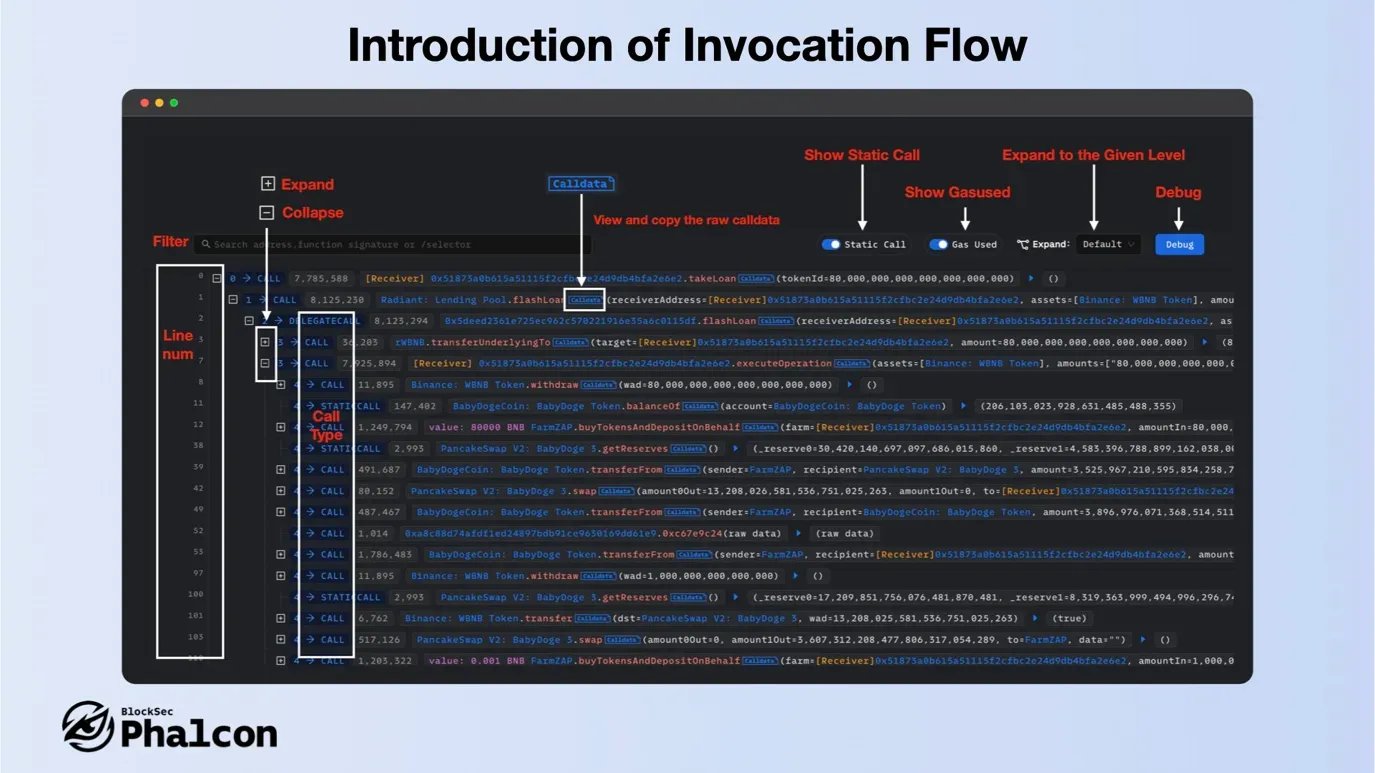
- Layout
The top toolbar features filters, switches for Static Call and Gas used, and a Debug entry. You can expand to a specific level for complex transactions, and line numbers on the left provide quick navigation. On the right, the call trace tree presents function calls and events with in-depth data.
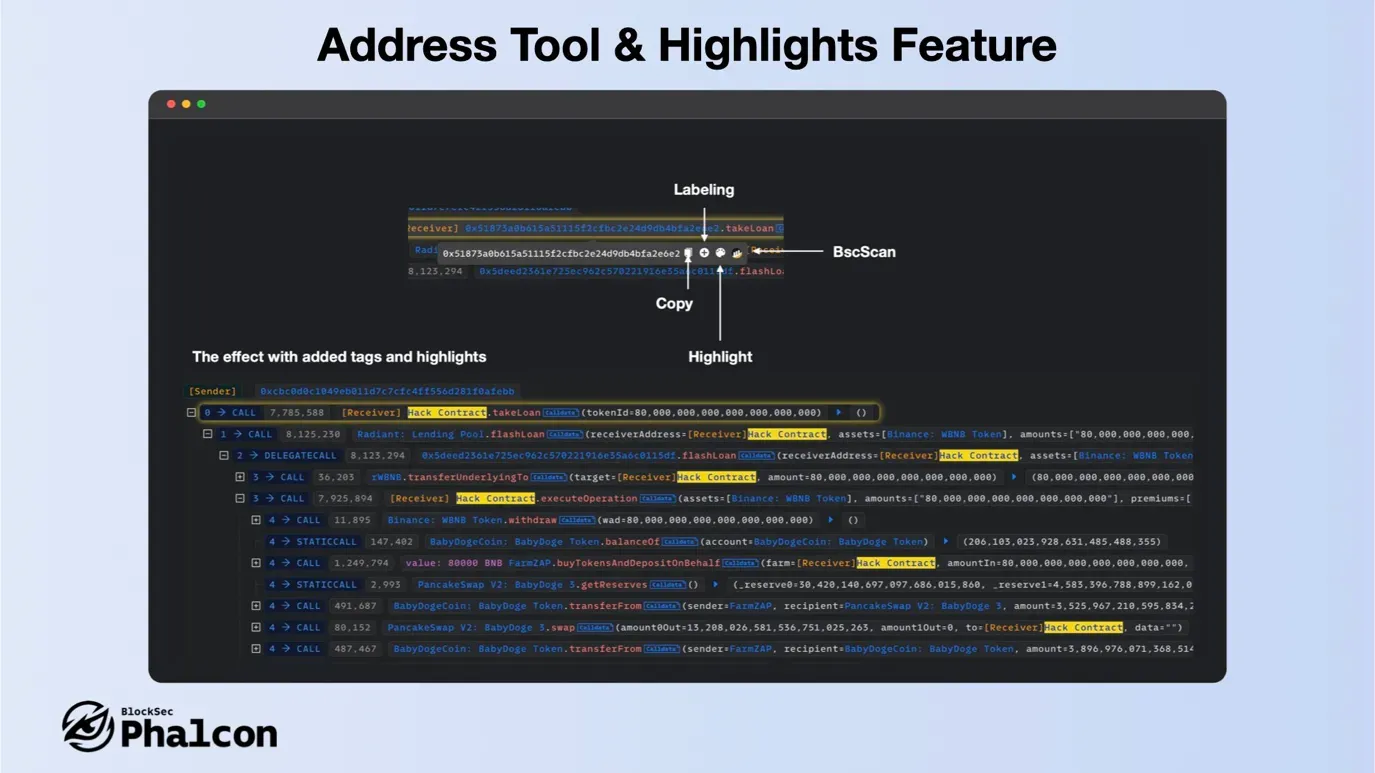
- Address Tags and Highlight Feature
Each address has the following tools: Copy / Add Label / Highlight / Go to *Scan (Like Etherscan).
Highlighting is a very useful feature, it marks the caller and the address appearing in the parameters.
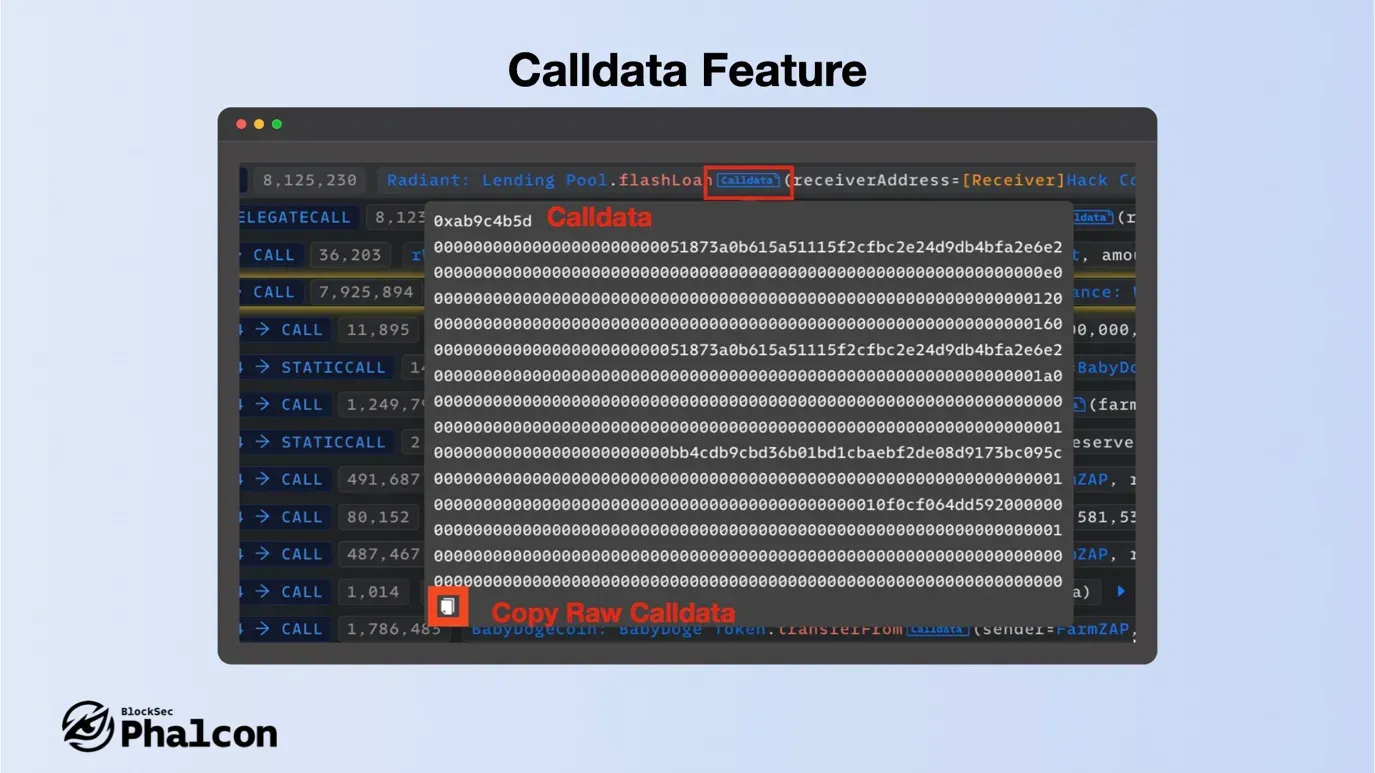
- Calldata Feature
The calldata is displayed with line breaks at function selector + 64*n, helping you to view parameters in a structured way. Clicking the copy button at the bottom allows you to copy the raw data (excluding line breaks).
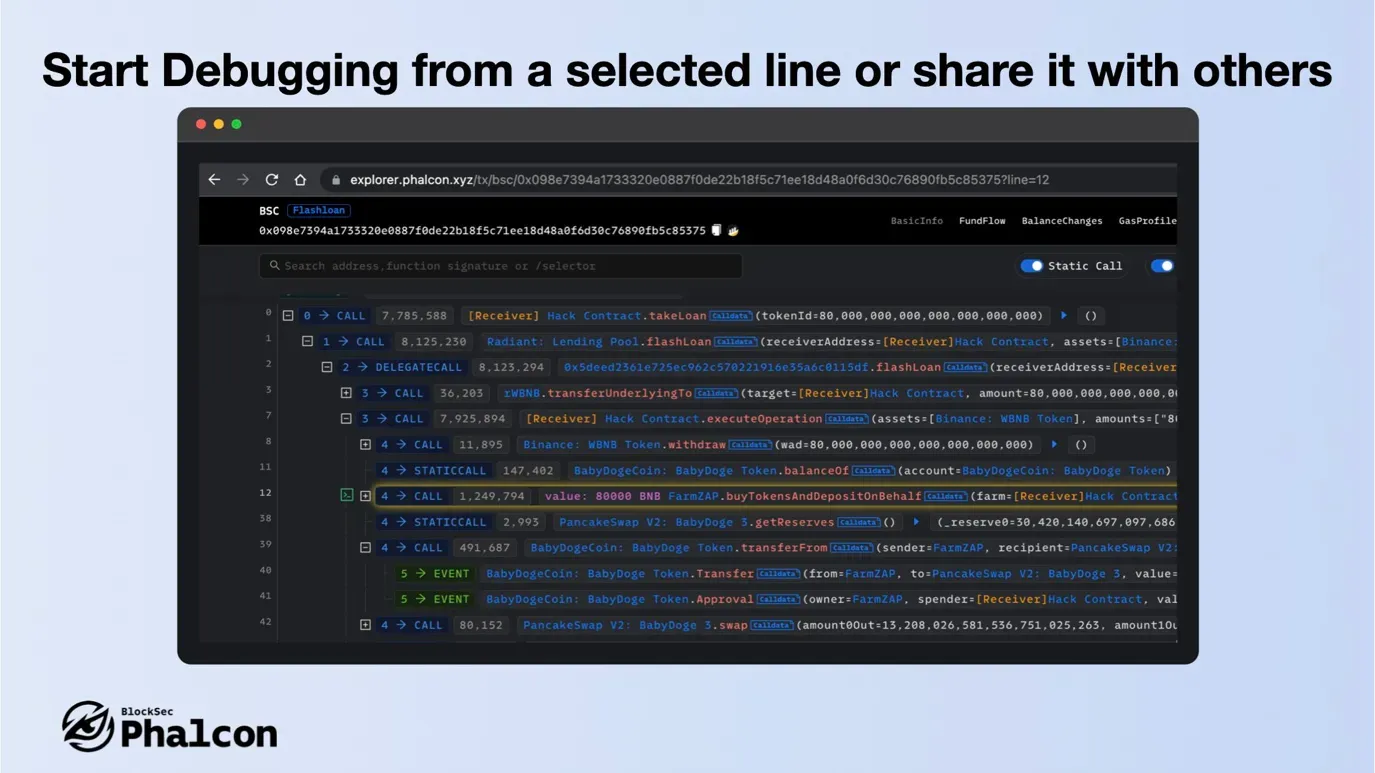
- Start Debugging from a selected line or share it with others
Select a line to start debugging from this line or share it with other users. The URL will contain the line number, and other users will be directly taken to the corresponding line when they open it.
Feature 6: Presenting Powerful Transaction Debugging
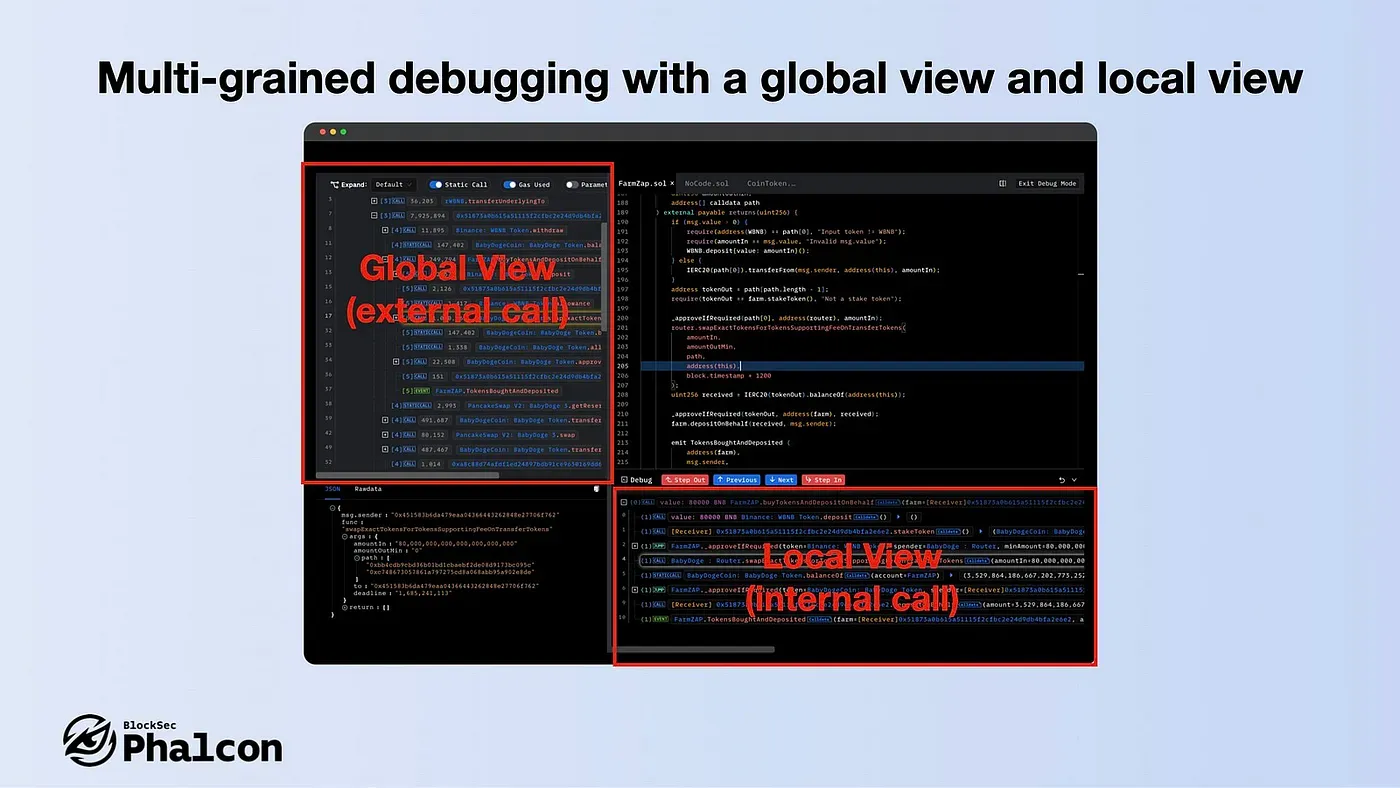
Phalcon provides the jump-level debug to analyze the transaction. Here are 4 powerful features.
- Multi-grained debugging with a global view and local view
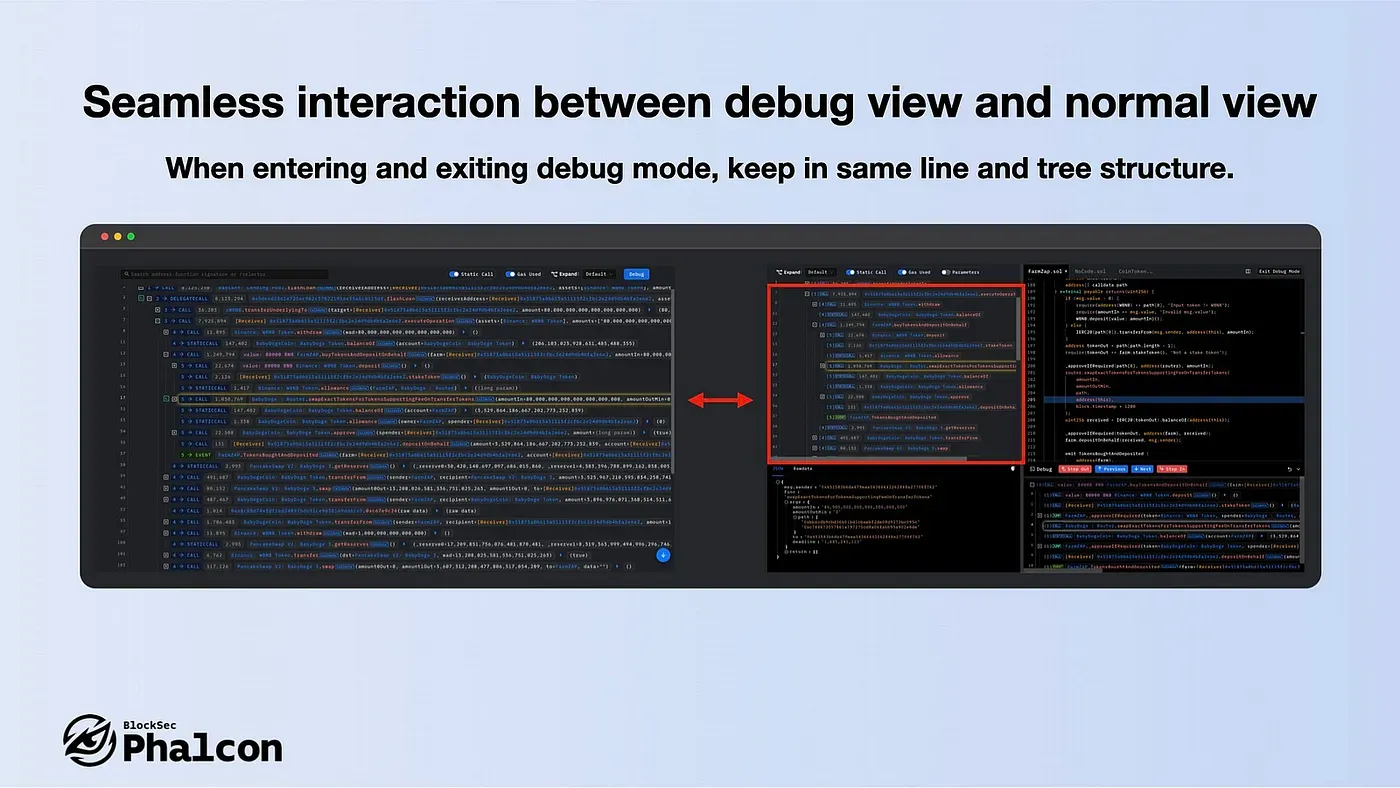
- Seamless interaction between debug view and normal view
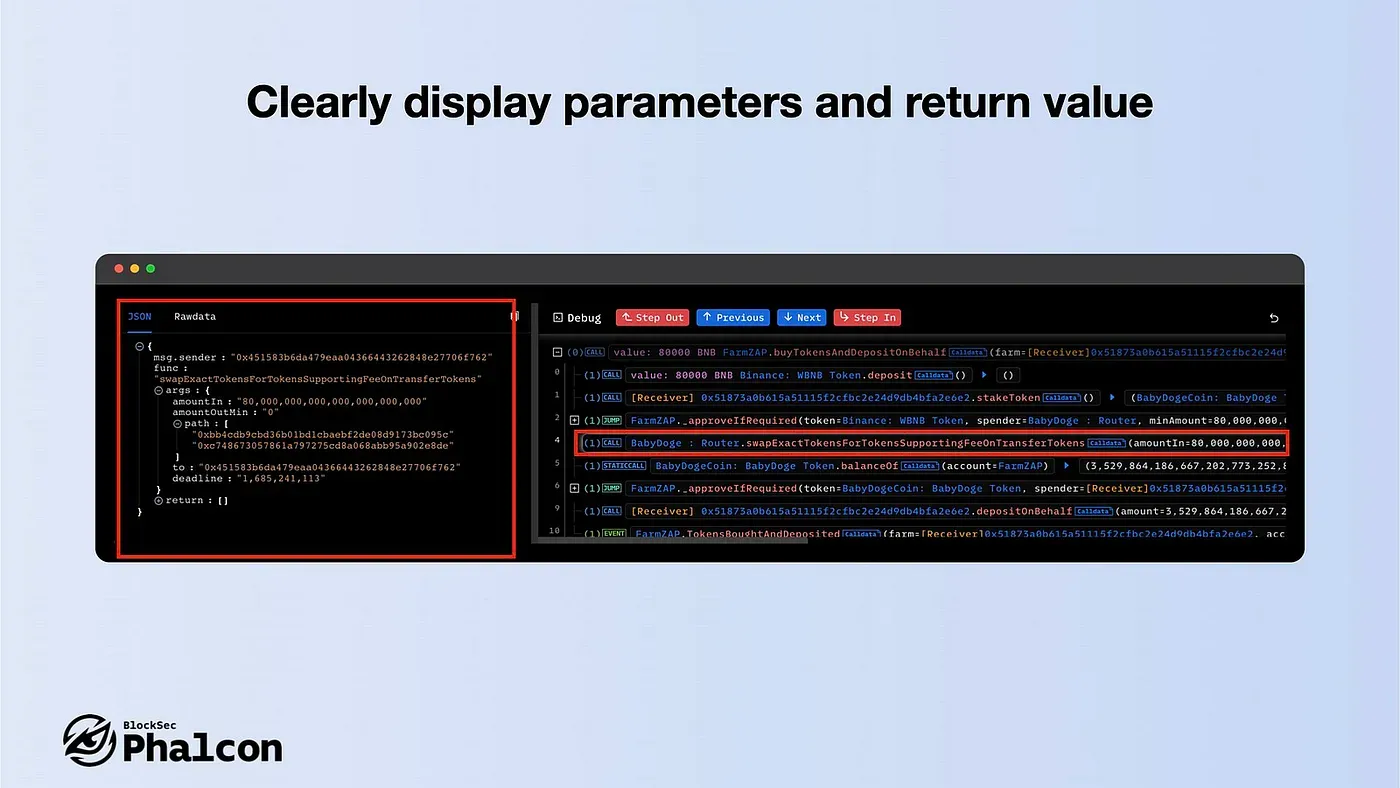
- Clearly display parameters and return value
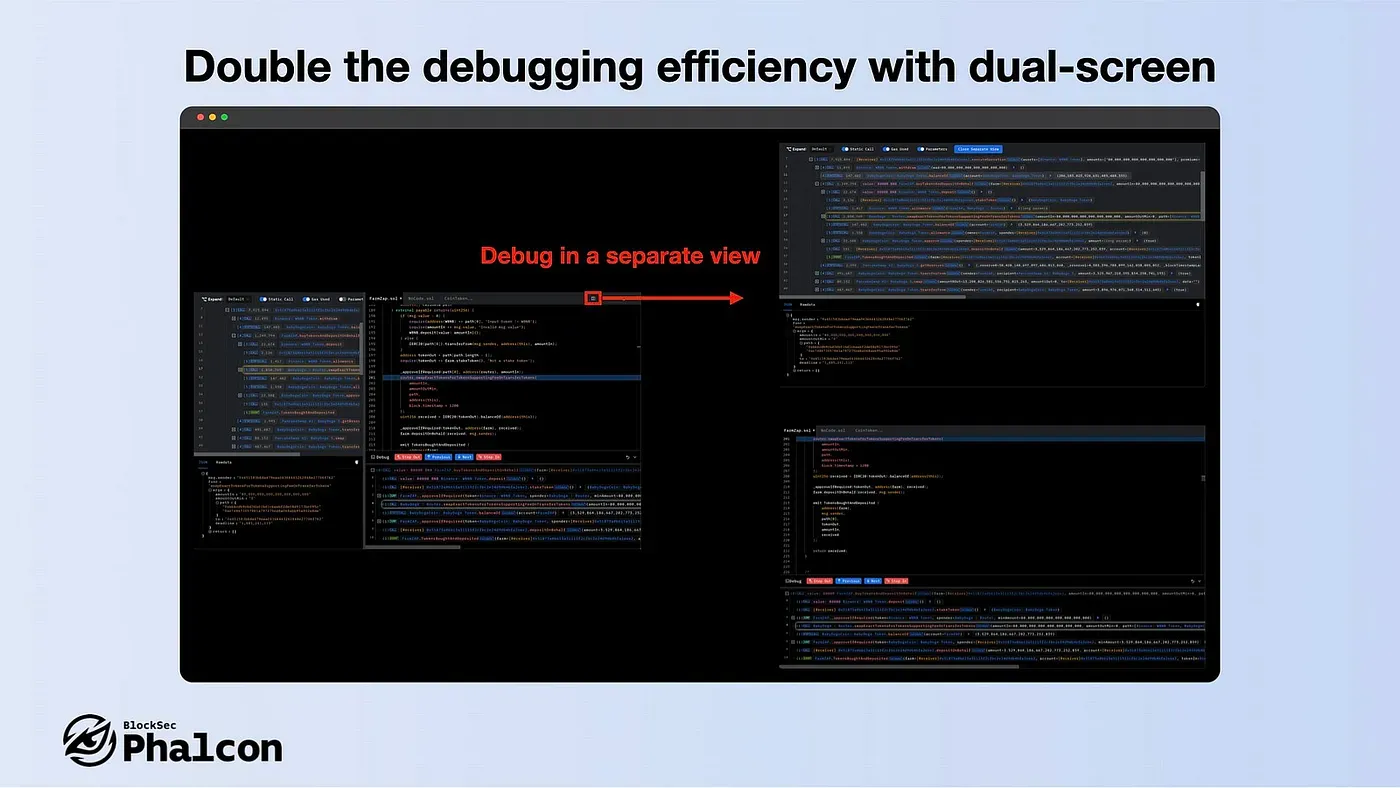
- Double the debugging efficiency with dual-screen
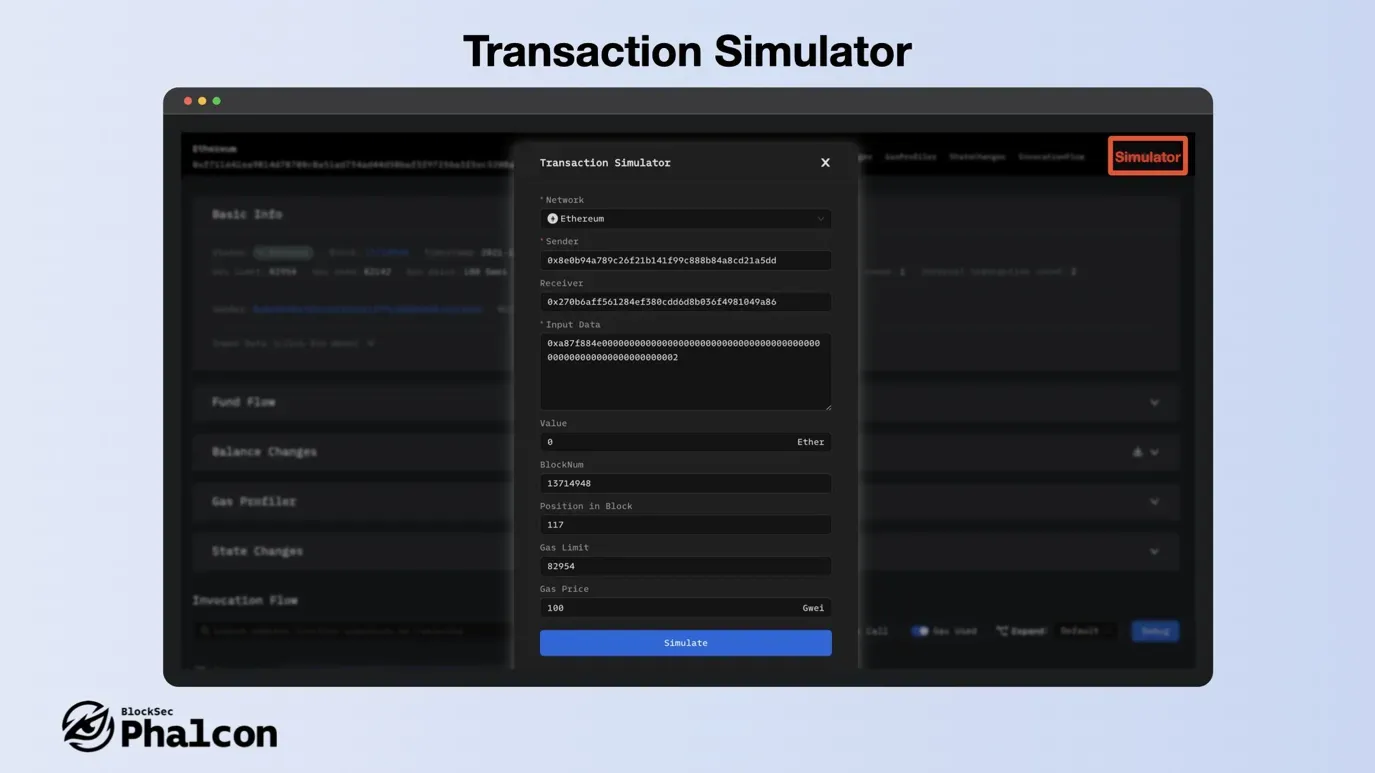
Feature 7: Presenting Transaction Simulation
Phalcon provides an industry-leading simulator that is both convenient and fast. To use the simulator, click on the “Simulator” button in the upper right corner, adjust the parameters to your liking, and then re-simulate.
We are excited to announce that a significant upgrade is coming soon. Stay tuned for more information!
We hope this overview of Phalcon’s 7 key features has been helpful in showcasing the power and flexibility of this innovative security suite. With the strong technical and market expertise of our development team, we were able to launch Phalcon in just 8 months. We’re confident that we can continue to provide deep and diverse product experiences for our users, while maintaining a focus on security and efficiency.
Thanks again for joining our “7 Days of Phalcon” journey, and stay tuned for more exciting updates and insights from the Phalcon team! By the way, Be sure to keep an eye out for our upcoming performance at #ETHBelgrade — we can’t wait to show you what we’ve got!
Follow us for more information:
Official Website: https://blocksec.com/phalcon
Official Twitter: https://twitter.com/phalcon_xyz