返回部落格

How to Visualize Crypto Money Flows

MetaSleuth
2026年9月30日
閱讀約 5 分鐘

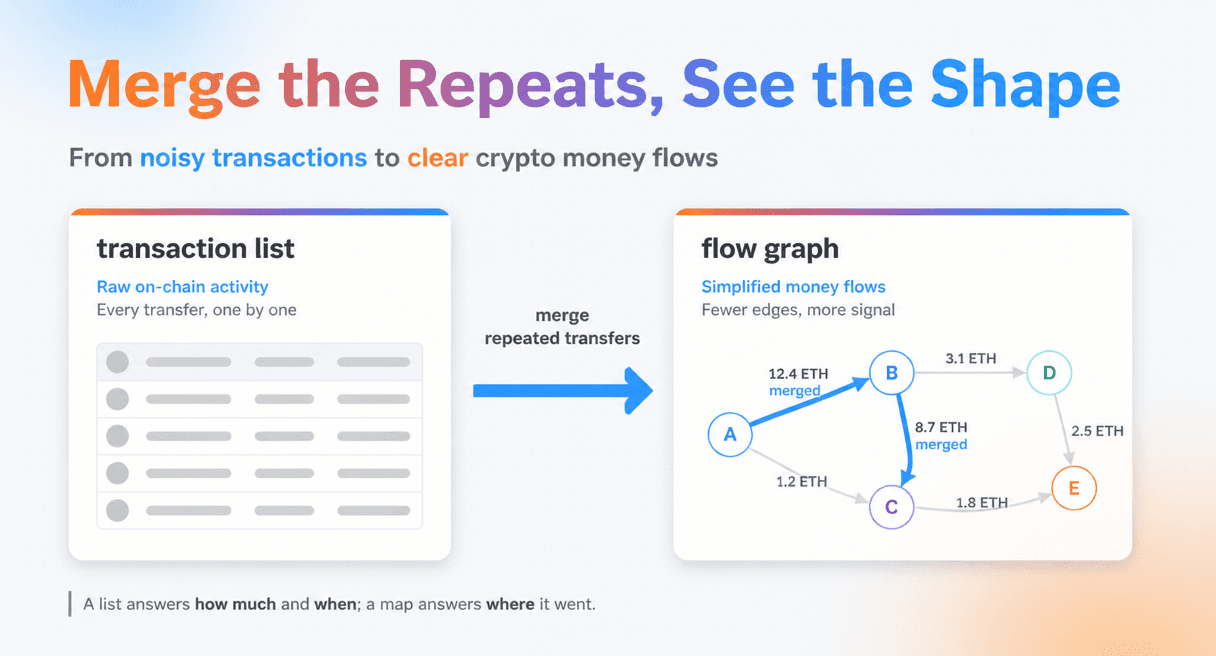
To visualize crypto money flows, turn the transaction list into a navigable graph of nodes and edges, then merge repeated transfers between the same two addresses into a single edge. A raw blockchain explorer hands you a spreadsheet: one row per transfer, thousands of rows, and no visible shape. A flow graph hands you a map, where addresses become nodes, transfers become edges, and the route from a stolen wallet to an exchange becomes something you can follow with your eyes.

The mental model that makes this work is simple: a flow graph is a map, not a spreadsheet. A spreadsheet answers how much moved and when. A map answers where the value went and who it touched along the way. Those are different questions, and investigations live in the second one. That is why the same on-chain data, shown as a graph, can reveal a route that a spreadsheet hides.

What Makes Crypto Money Flows Hard to Visualize

The reason money flows are hard to picture is structural, not just a matter of scale. A single investigation can span thousands of addresses across multiple chains, and the same pair of addresses can trade the same token dozens of times. On a flat transaction list, each hop looks like a separate row, so the noise hides the route.

Three things create that noise. First, multi-hop routing: funds move through a chain of intermediate wallets, and each hop is a separate transaction that must be stitched together by hand. Second, address churn: an attacker spins up fresh addresses for every step, hiding the entity behind a wall of anonymous nodes. Third, cross-chain jumps: a trace that reaches a bridge does not end there. It continues on another chain, with a different token and a different set of addresses.

Consider a bridge exploit. The stolen funds leave the bridge, split into dozens of wallets, trade through a decentralized exchange, and cross to another chain. A flat explorer view shows each of these steps as unrelated rows. The investigator has to hold the whole route in their head, hop by hop, while the actual answer, where the funds finally land, stays buried in the list.

Each of these problems is solvable, but none of them is solved by a longer spreadsheet. Adding more rows to a flat list only adds more noise. The fix is to change the representation itself, from a list of events to a structure of relationships.

How to Read and Build a Money Flow Graph

A money flow graph has three elements: nodes, edges, and labels. A node is an address or a wallet, the place funds sit. An edge is a transfer of value between two nodes. A label is the human-readable name attached to a node or an edge, such as an exchange, a bridge, or a mixing service. Reading the graph means following the edges from the source address to the destination and watching where the value concentrates and splits. Many of those trails are laundering routes. Money laundering, as FinCEN defines it, means disguising financial assets so they can be used without detection of the illegal activity that produced them.

The single most important technique is edge merging. When the same token moves between the same two addresses many times, those transfers are not separate facts. They are one relationship. Collapsing them into a single edge turns a thousand-row transaction list into a small number of meaningful connections, and it reveals the structure of the money movement instead of its volume. This is the difference between seeing that an address sent funds to an exchange and seeing how many separate transfers it took to get there. Regulators read that structure too. The FATF red flag indicators name the transaction patterns that signal laundering, and those patterns become visible once repeated transfers are merged.

Cross-chain movement makes the graph harder to read, so a good visualization keeps the view connected. When funds cross a bridge, the trace should continue on the other side rather than stopping at the border. Address labels do the rest of the work, because a graph full of raw hashes stays unreadable until the nodes carry names.

Building a graph follows the same order in reverse. You add the seed address, expand its outgoing transfers, merge the repeated ones, and only then step back to look at the shape. The shape, not the transaction count, is what points to the next address to investigate.

A transaction list becomes a flow graph when repeated transfers between the same two addresses me...

How MetaSleuth Makes Visualization Actionable

This is where the tooling stops being a drawing exercise and starts doing the work for you. MetaSleuth visualizes fund flows by graphing the aggregated movement of tokens between addresses, merging multiple transactions of the same token between each pair of addresses into a single edge. That is the merge-edge logic at the center of MetaSleuth's flow visualization.

Three more features make the map actionable. MetaSleuth supports cross-chain transaction tracking, so a flow map can carry a single investigation across chains instead of ending at a bridge. It carries more than 600 million address labels too, and those labels turn a raw address into a named entity on the graph. The Saved Charts and Shared Links panel in MetaSleuth lets an investigator save a chart and share the analysis result with a teammate or an external reviewer.

The result is a map you can hand to someone else. MetaSleuth anchors each finished investigation to a shareable online canvas, where a reader can reopen the same flow map the analyst built. An analyst can start from a suspicious address, expand the outgoing flows, merge the repeated transfers, and follow the value across chains until it lands at an exchange or a named service. The graph does not replace the analyst's judgment. It removes the mechanical work of stitching transactions together, which is where investigations lose the most time. For an investigator or a law enforcement team, that shift from manual stitching to a labeled, cross-chain map is what makes visualization actionable rather than decorative.

If you are staring at a flat transaction list and trying to answer where the money went, the fix is to give the data a shape. Start with the address you care about, add the addresses on the other side as nodes, and merge the repeated transfers so the real relationships emerge. Then follow the edges across chains and let the labels name the destinations. Visualize flows with MetaSleuth and turn a raw transaction dump into a money flow graph you can actually read. For the full tracing method behind the map, see How to Trace a Crypto Wallet Address.

用 MetaSleuth Investigation 深入追查

用 BlockSec 的 MetaSleuth Investigation 擴展你的數字貨幣合規能力——首個用於追蹤資金、繪製交易網路、揭示隱藏鏈上關聯的平臺。

藉助清晰的視覺化洞察與可直接取證的工作流,在整個數字資產生態中更快地從發現問題走到解決問題。

MetaSleuth Investigation
How to Visualize Crypto Money Flows